
BASIS - Week 1 Foundations Architecture and Core Operations / SAP BASIS AS ABAP Runtime Architecture and Request Processing
Result :
SAP BASIS AS ABAP Runtime Architecture and Request Processing
Introduction
Purpose
This chapter explains how an ABAP application server accepts a request, assigns it to a runtime process, accesses data and returns a result. The aim is not only to name components, but to show how a BASIS administrator uses those relationships during monitoring and incident analysis.
The central operating idea is that a user session is not permanently tied to one dialog work process. The dispatcher queues each dialog step and assigns it to an available process. This design supports many users with a controlled pool of runtime resources.
Who Should Read This Chapter
The chapter is intended for new and working SAP BASIS administrators, infrastructure specialists supporting AS ABAP, and application support staff who need to interpret server and work-process evidence before escalation.
Learning Objectives
After completing this chapter, the reader should be able to describe an AS ABAP instance, distinguish work-process types, trace a dialog request, explain work-process multiplexing, relate SAP locks and update processing to data consistency, and perform a safe first analysis with SM51, SM50 and SM66.
The chapter is designed around these practical outcomes:
- Describe the components of an AS ABAP application server instance.
- Trace a frontend request through the dispatcher and a work process.
- Distinguish dialog background update spool and enqueue services.
- Explain dialog-step multiplexing and user-context handling.
- Relate ABAP SQL buffers locks and update processing to consistency.
- Use SM51 SM50 and SM66 for a safe first diagnosis.
Scope and Version Context
The training source describes SAP R/3 4.6B. Dispatcher queues, dialog steps, work-process types, the database interface and SAP logical locks remain foundational concepts. However, current AS ABAP architecture separates central services more clearly.
In older descriptions, enqueue processing may appear as an enqueue work process in the central instance. In current ABAP Platform documentation, the central lock table is managed by a standalone enqueue server in the ABAP Central Services instance. Always interpret screens and process names according to the installed release and architecture.
Inside an AS ABAP System
Runtime Building Blocks
An AS ABAP system combines application server instances, central services, a database and communication components. Each application server instance supplies processing capacity through a dispatcher and work processes. Shared memory holds runtime administration data, user contexts and buffers that processes on the same instance can use.
The database remains the durable store for business data, repository objects and configuration. Application server memory improves runtime efficiency, but it does not replace database persistence or transaction control.
The runtime components have different scopes and responsibilities.
| Component | Scope | Primary responsibility |
| Dispatcher | One application server instance | Queues and assigns requests |
| Work process | One operating system process | Executes a request of its configured type |
| Shared memory | One application server instance | Holds contexts administration data and local buffers |
| Message server | One ABAP system | Coordinates registered instances and communication |
| Enqueue server | One ABAP system | Maintains the central logical lock table |
| Database | One ABAP system | Stores durable business and repository data |
Application Server Instances
An application server instance is a startable and monitorable unit on a host. It normally includes a dispatcher, gateway, Internet Communication Manager where configured, shared memory and a defined set of dialog, background, update and spool work processes.
A system can have several application server instances. Each instance has its own dispatcher, queues, work processes and local buffers. A problem may therefore affect one instance while other instances continue to serve users.
Central Services in Modern Systems
The ABAP Central Services instance provides the message server and standalone enqueue server. The message server supports communication and registration across instances and participates in logon load distribution. The enqueue server maintains the central logical lock table for the ABAP system.
High-availability designs may add enqueue replication. The exact processes depend on the product release and enqueue architecture, so operational procedures must match the system build rather than an old central-instance diagram.
Dispatcher and Request Queues
Dispatcher Responsibilities
The dispatcher is the traffic controller of an application server instance. It receives requests, classifies them, places them in the appropriate queue and assigns them to free work processes of the required type. It also participates in communication between the frontend and the runtime processes.
During instance startup, runtime configuration determines the available work processes and shared-memory areas. A healthy dispatcher does not guarantee that every request is fast; queue length, work-process availability, database response and locks must also be considered.
From Frontend Request to Work Process
A frontend action sends compact request data to the selected application server. The dispatcher places the request in a queue. When a suitable work process becomes available, that process restores the user context, executes the dialog step, performs buffer or database access as needed, and returns the result through the dispatcher.
The result is rendered by the frontend. The next user action creates another dialog step and may be executed by a different dialog work process on the same application server.
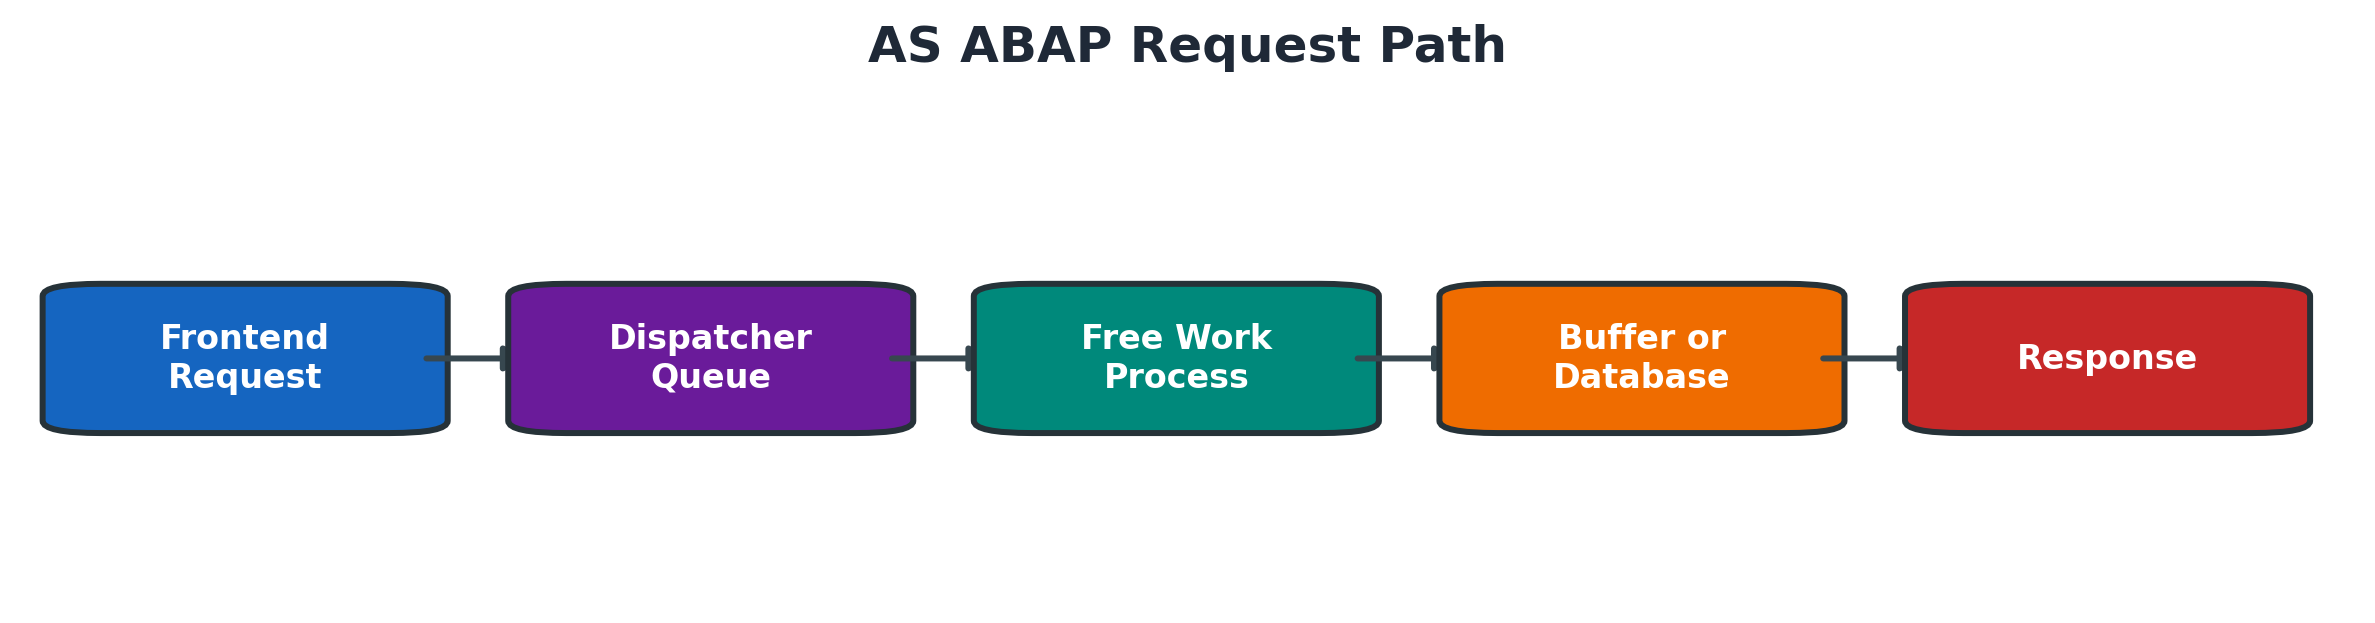
Figure 2.1 AS ABAP request path
Why Queue Health Matters
A queue grows when requests arrive faster than suitable work processes can accept them. The cause may be temporary load, long-running programs, external waits, database latency, locks or an unsuitable work-process distribution.
Do not treat a queue value in isolation. Compare the affected instance with other instances, confirm the time window and review active process states before changing parameters or terminating work.
Work Process Types
Dialog Work Processes
Dialog work processes execute interactive dialog steps and many short application requests. They should return capacity quickly so other users are not delayed. A long-running dialog step can occupy a process and contribute to dispatcher queue growth.
A dialog process may execute steps for many users over time. Its process number identifies the runtime process, not a permanently assigned end user.
Each service has a distinct runtime purpose and diagnostic path.
| Process or service | Primary use | Main monitoring context | Operational caution |
| Dialog | Interactive and short application requests | SM50 or SM66 | Long step reduces online capacity |
| Background | Scheduled non-interactive jobs | SM37 with SM50 or SM66 | Job can still consume locks memory and database resources |
| Update | Applies registered database changes | SM13 with process overview | Failure can leave business update incomplete |
| Spool | Formats and transfers output requests | SP01 SPAD and process overview | Separate SAP spool from host or device failure |
| Enqueue server | Maintains system-wide logical lock table | SM12 and enqueue monitoring | Intervention can affect data consistency |
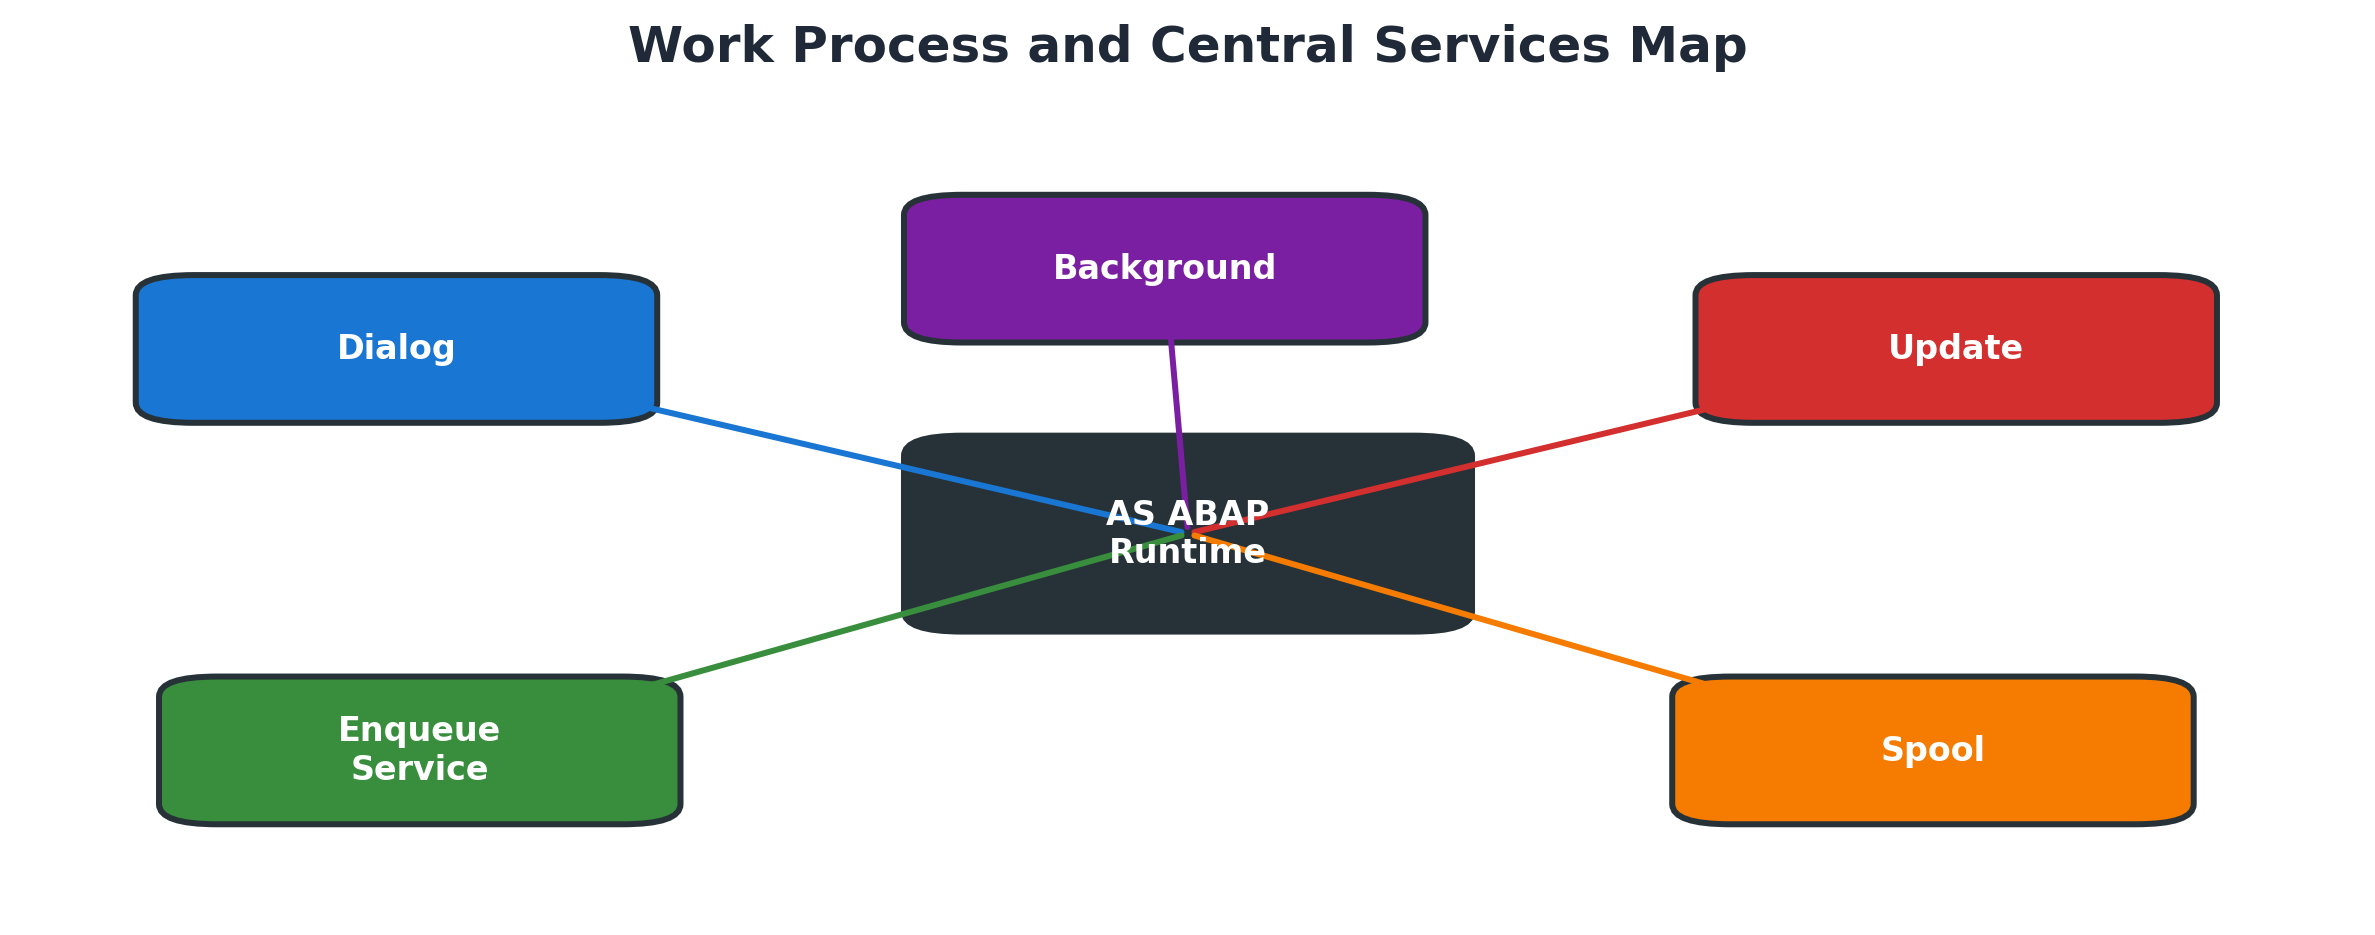
Figure 2.2 AS ABAP processing services
Background Work Processes
Background work processes execute scheduled jobs without an interactive frontend session. They are suitable for planned, long-running or periodic work, provided the job is correctly designed and scheduled. Background execution does not remove database, lock or memory impact; it changes how the workload is managed.
Update Work Processes
Update work processes apply database changes registered by application logic. Asynchronous update allows the dialog portion to complete its controlled handoff while the update task performs the durable change. Update status must be checked when users report that a transaction completed but expected data is missing.
Spool Work Processes
Spool work processes prepare output requests for host spool systems and output devices. A business transaction may create a spool request even when no physical printing occurs. Problems should be separated into SAP spool creation, formatting, host-spool transfer and device delivery.
Enqueue Service and Lock Management
SAP logical locks protect business objects across dialog steps and database transactions. In current AS ABAP architecture, work processes act as enqueue clients and the standalone enqueue server maintains the central lock table. Older R/3 material may describe an enqueue work process instead.
A lock is not automatically an error. It is evidence that another logical unit of work currently protects an object. The administrator must identify the owner, age and business context before deciding whether intervention is justified.
Dialog Step Processing
PBO and PAI
A classic dynpro dialog step involves Process After Input and Process Before Output. PAI validates and processes the user input from the current screen. Application logic determines the next state, and PBO prepares the next screen before the response is sent to the frontend.
The user may spend minutes reading a screen, but a work process is not reserved for that thinking time. Runtime capacity is used while a system dialog step is being processed.
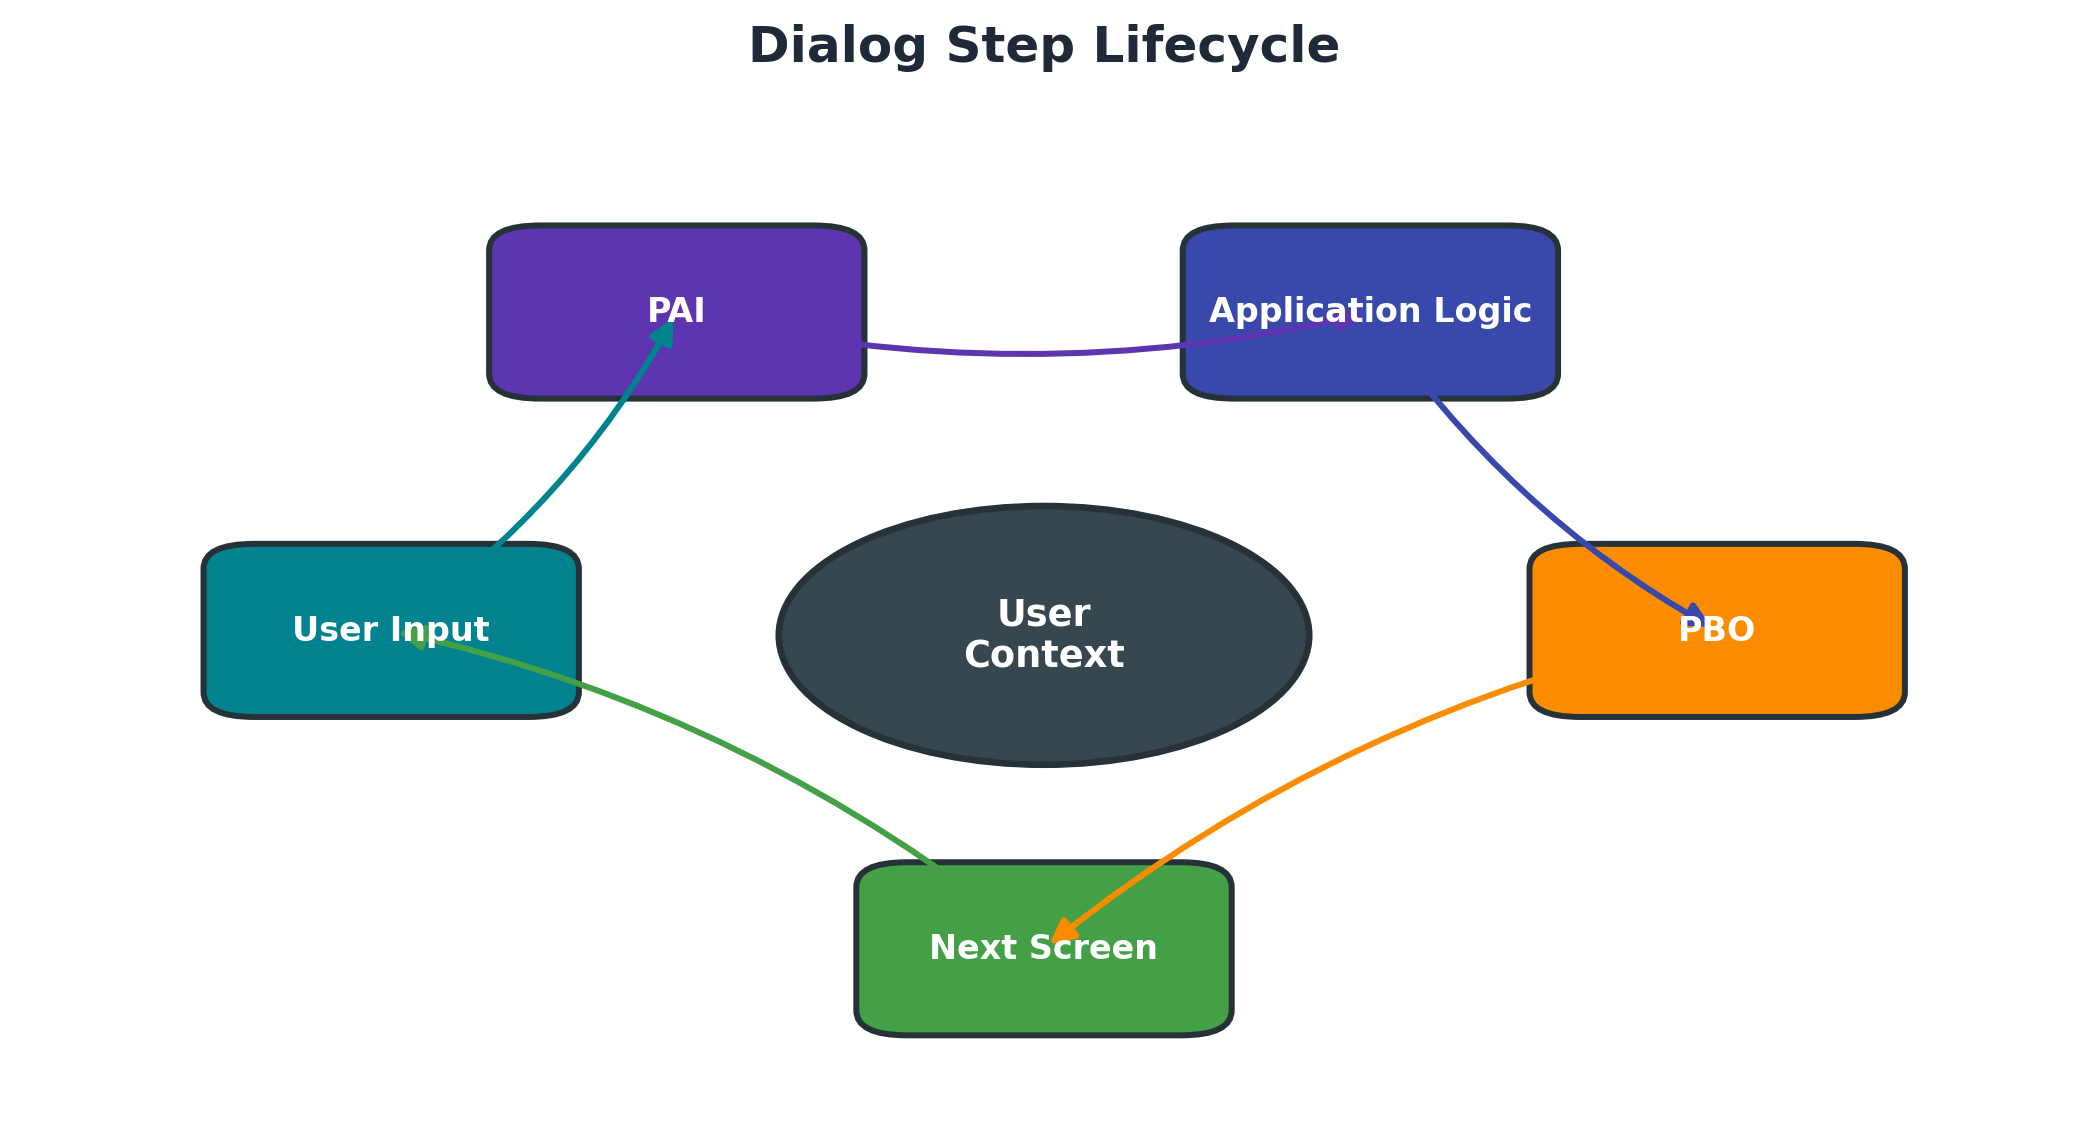
Figure 2.3 Dialog step lifecycle
Work Process Multiplexing
Multiplexing means that consecutive screens of one SAP transaction can be processed by different dialog work processes. The dispatcher selects an available process for each new request. This allows a smaller process pool to support many logged-on users.
Because the next step may run elsewhere, transaction context cannot live only in private process memory. Required user context is rolled out after a step and rolled in when another process continues the session.
User Context and Roll Handling
The user context contains session-specific information needed to continue processing. The task handler coordinates the restoration and preservation of that context around a dialog step. Modern memory management is more complex than the historical roll-area model, but the administrative principle remains: user context survives while dialog processes are shared.
High memory use should be analyzed with release-appropriate memory tools and parameters. Do not assume that every large process indicates a leak; program design, internal tables, extended memory and heap transitions all affect the observed process.
Long Running Dialog Steps
Long dialog steps reduce the number of processes available for interactive work. A process can be running, waiting on the database, waiting for a lock, communicating externally or stopped in another runtime condition. The process state and reason are more useful than elapsed time alone.
If a business workload is expected to run for a long time, evaluate whether it belongs in controlled background processing. Moving work blindly can shift rather than solve the bottleneck.
Database Access and Buffering
ABAP SQL and the Database Interface
ABAP SQL, historically called Open SQL, provides database-independent access to tables known to the ABAP Dictionary. The database interface converts requests through the database-specific layer and coordinates supported buffering behavior.
The database interface exists in each work process. Poor application SQL can still create expensive database work, so platform independence does not guarantee efficient access.
Use the correct access concept when interpreting database behavior.
| Access path | Behavior | Administrative meaning |
| ABAP SQL | Database-independent language integrated with ABAP | Can use supported SAP buffering and Dictionary metadata |
| Native SQL | Database-specific statements | Requires database-specific expertise and reduces portability |
| SAP table buffer | Instance-local shared-memory copy for eligible data | A hit avoids a database read but must remain consistent |
| Direct database tool | Operates outside normal application transaction flow | Use only under approved expert procedure |
Native SQL Considerations
Native SQL sends database-specific statements with less abstraction. It can use functions not available through ABAP SQL, but it reduces portability and requires careful technical ownership. BASIS administrators should not change or execute database-specific statements in production without an approved procedure and qualified database or development support.
Shared Memory and Local Buffers
Application server shared memory contains buffers for frequently used repository and table information. A buffer hit avoids a database read and can reduce response time. Buffering is appropriate only for objects whose technical definition and change pattern support it.
Each application server instance has local buffer state. A buffer problem can therefore appear on one instance and disappear when a user logs on to another, which is an important diagnostic clue.
Buffer Consistency Across Instances
Distributed instances must recognize changes that invalidate local cached content. Buffer synchronization mechanisms coordinate invalidation, but timing and configuration still matter. Administrators should compare instance scope, buffer quality and change history before resetting a buffer.
A broad buffer reset can cause a temporary surge of database reads and should not be used as a routine response to an unexplained performance complaint.
Transaction Consistency
SAP LUW and Database LUW
An SAP logical unit of work can span several dialog steps, while each database logical unit of work is bounded by database commit or rollback. SAP coordinates business consistency above the individual database interaction so that a multi-screen transaction can behave as one business action.
Logical Locks
Database locks generally last only within a database transaction. SAP logical locks can protect a business object across several dialog steps. Applications set and release these locks through generated or explicit enqueue operations.
The lock key and lock mode determine what is protected. Deleting a lock without understanding the application state can permit conflicting changes or leave an incomplete business process.
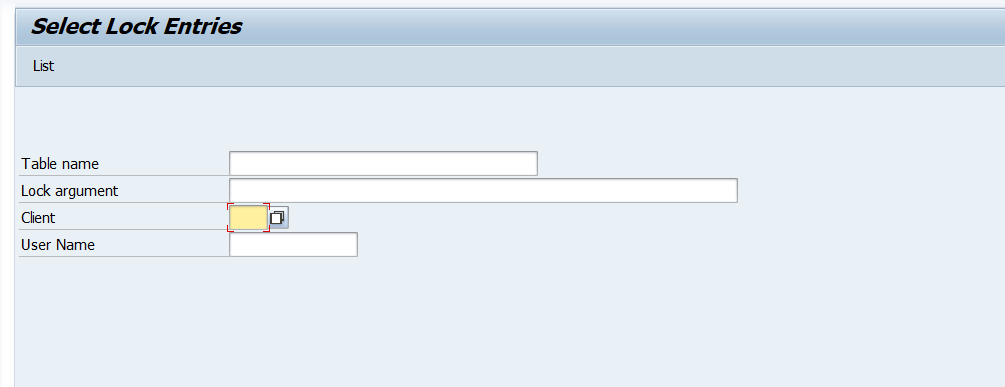
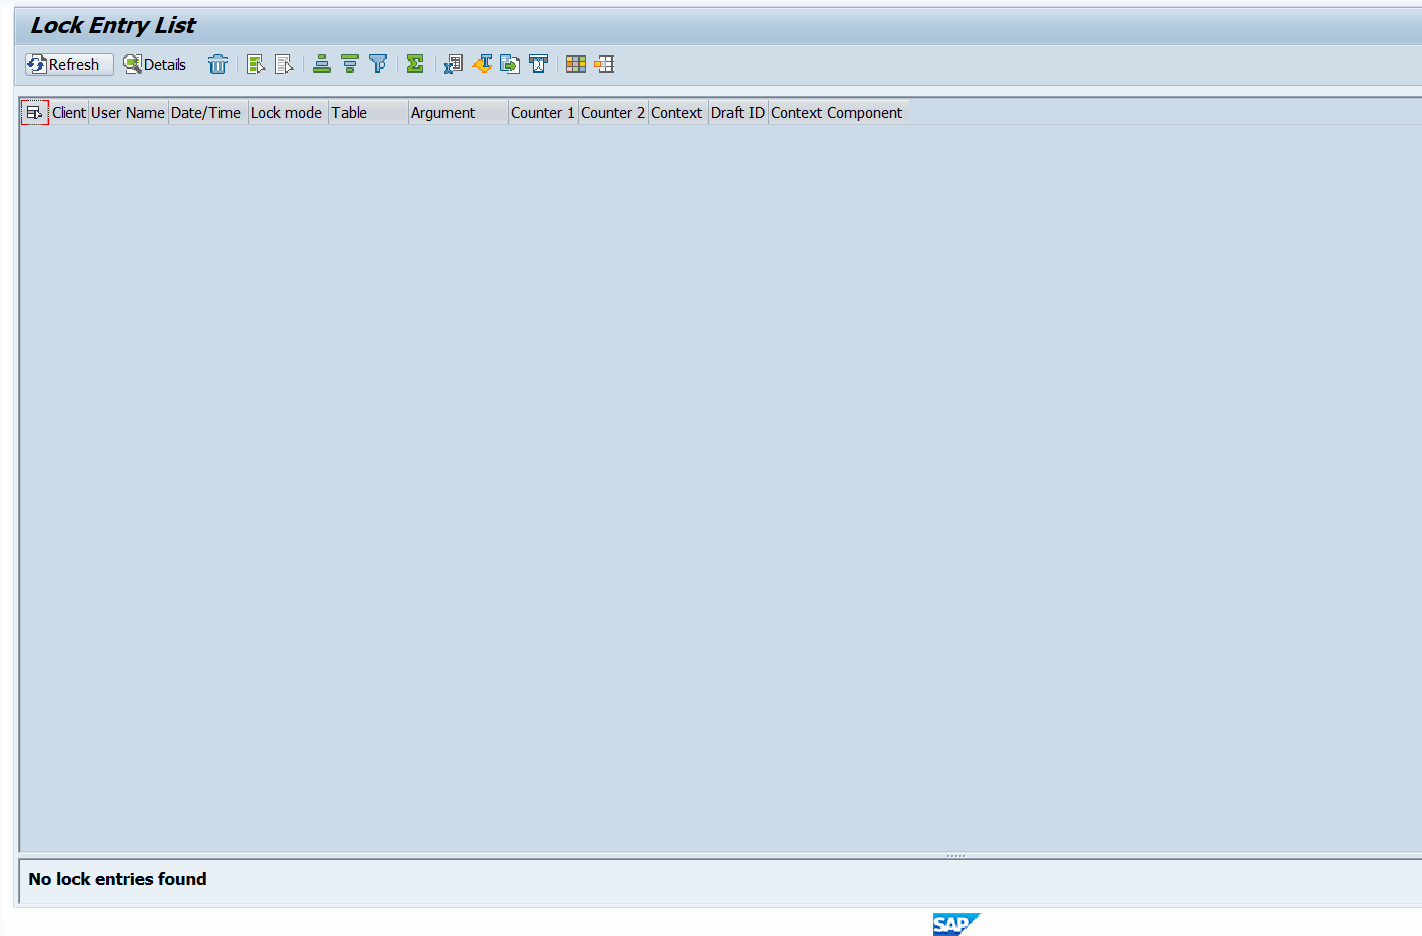
Click on list
Screenshot 2.1 - SM12 lock selection and lock-entry result list
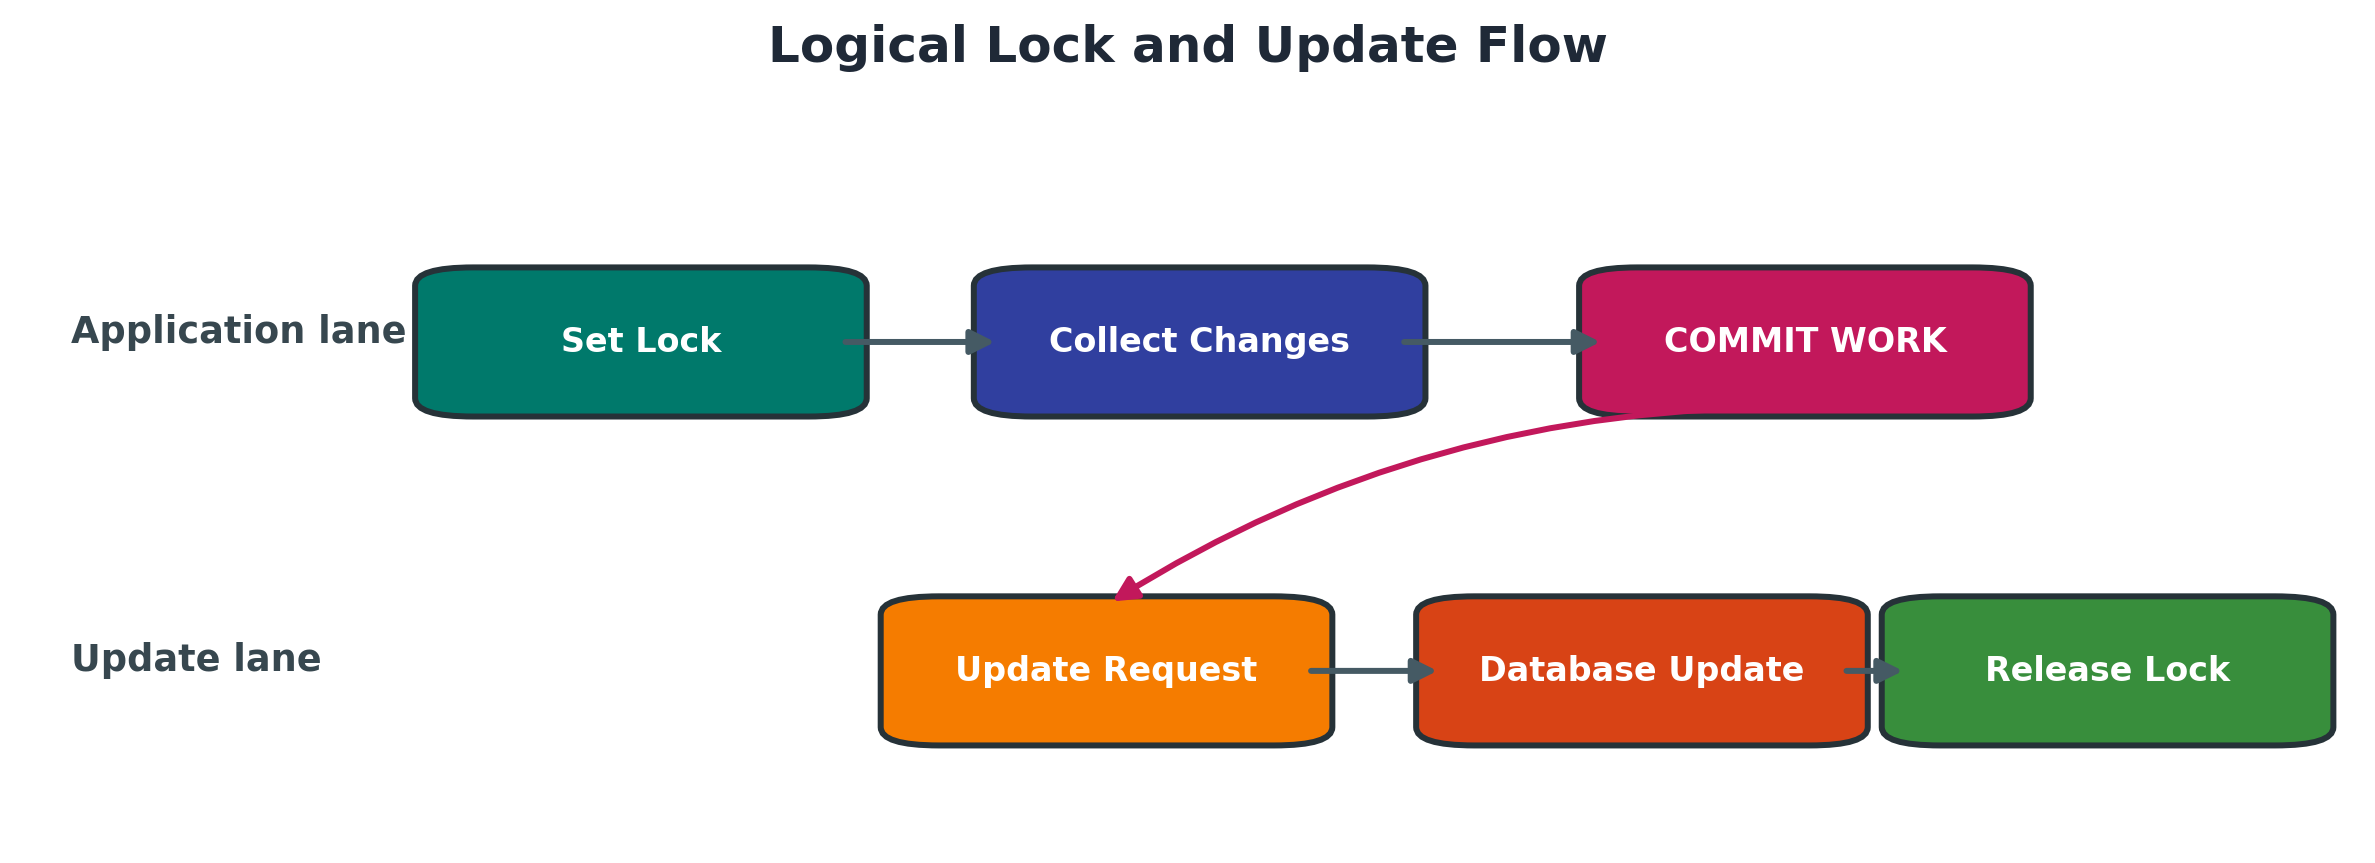
Figure 2.4 Logical lock and update flow
Asynchronous Update
At COMMIT WORK, registered update tasks are handed to update processing. The update work process reads the recorded request and applies the database changes. If processing fails, the update record and error evidence must be analyzed before any repeat or manual correction.
SM13 Update Records
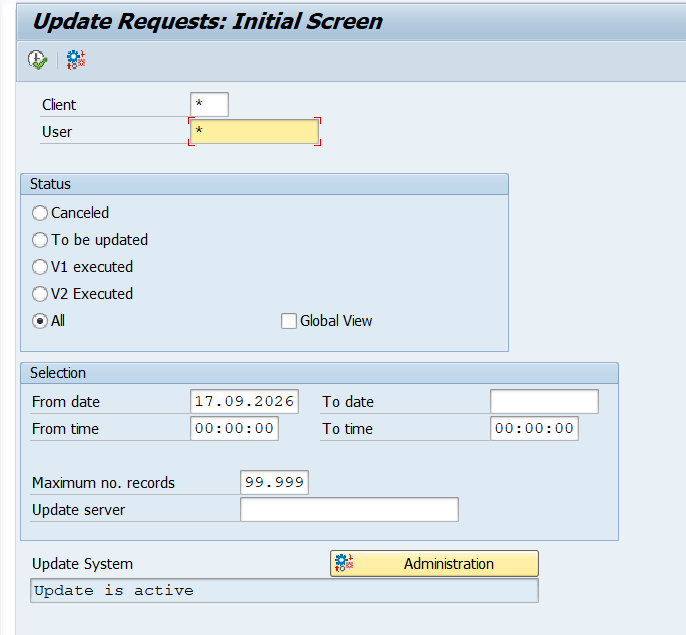
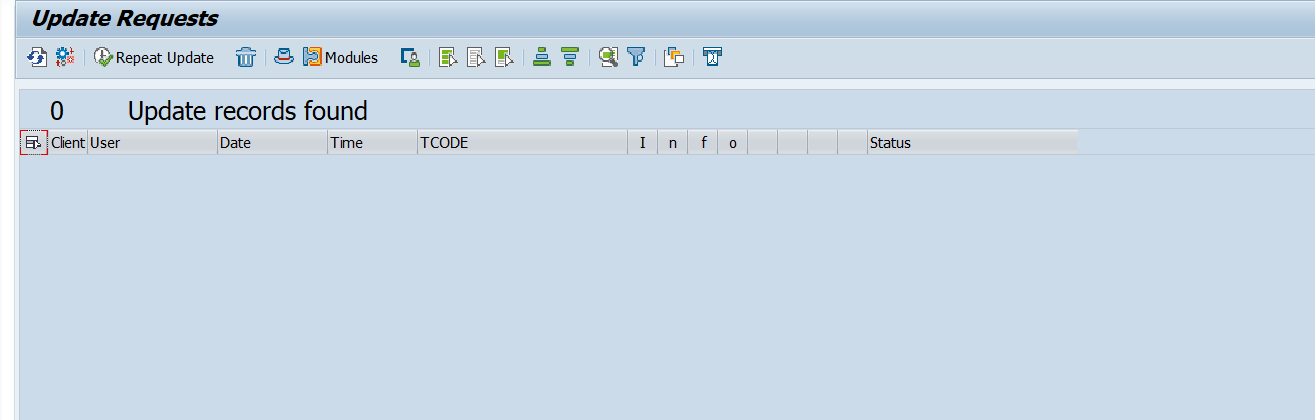
Click on Execute
Screenshot 2.2 - SM13 update-request selection and zero-record result
Commit and Rollback Boundaries
COMMIT WORK closes the intended SAP LUW and triggers registered update handling. ROLLBACK WORK cancels database changes and update registrations within the relevant context. Administrators should never use database-level commit or repair actions as a substitute for understanding the application transaction.
Detailed Runtime Architecture
Instance Startup and Process Registration
An AS ABAP instance is started from its profiles and executable set. The start service launches the instance processes, the dispatcher reads the instance profile, creates or attaches the required shared-memory segments and starts the configured work processes. The gateway and Internet Communication Manager are separate runtime processes where configured. The dispatcher registers the instance with the message server so that the system can recognize it and, where logon groups are used, include it in load distribution.
A green operating-system process list is not sufficient proof that the instance is usable. Startup validation must combine process state, message-server registration, work-process availability, developer traces, system log and a controlled application test. A process can exist while it is repeatedly restarting, unable to attach shared memory, unable to connect to the database or not registered for normal logon traffic.
Important Profiles and Parameters
The default profile supplies system-wide defaults, while the instance profile defines instance-specific runtime capacity. Common work-process parameters include rdisp/wp_no_dia, rdisp/wp_no_btc, rdisp/wp_no_vb, rdisp/wp_no_vb2 and rdisp/wp_no_spo. The exact supported parameters and dynamic behavior depend on release. Never copy values from another system without sizing, workload and supportability review. Changes must be made through the approved profile-management and restart process where required.
- rdisp/wp_no_dia defines the configured dialog work-process count for the instance.
- rdisp/wp_no_btc defines background work-process capacity and must align with job scheduling and operation modes.
- rdisp/wp_no_vb and rdisp/wp_no_vb2 define update capacity where the release uses these process categories.
- rdisp/wp_no_spo defines spool work-process capacity; output-server design must also be considered.
- Operation modes can change the dialog and background distribution at scheduled times without changing total configured capacity.
Dispatcher Queues and Request Selection
The dispatcher maintains queues for incoming requests that require a suitable runtime resource. It does not execute the application logic itself. A request waits until a compatible work process is free, after which the dispatcher associates the request with that process. Queue pressure therefore describes a mismatch between arriving demand and available service capacity; it does not by itself identify whether the cause is application code, database latency, external communication, locks, memory pressure or poor capacity distribution.
A useful investigation compares three dimensions: request arrival, work-process occupancy and the reason occupied processes are not returning quickly. If all dialog processes are running the same expensive report, the owning application or workload is the likely focus. If many processes show database waits, database and SQL evidence is required. If only one instance is affected, compare its queue, buffers, host resources and dependent routes with a healthy instance.
End to End Dialog Request Flow
- 1. The user performs an action in SAP GUI or another supported frontend channel.
- 2. The request reaches the selected application server instance through the established connection.
- 3. The dispatcher classifies and queues the request for a compatible work-process type.
- 4. A free dialog work process receives the request and restores the required user context.
- 5. The task handler coordinates screen logic, ABAP execution, authorization checks and service calls.
- 6. ABAP SQL is converted by the database interface; eligible repository or table data may be served from buffers.
- 7. The work process may request a logical lock, call an RFC destination, register update tasks or create spool work.
- 8. The resulting screen data and messages return through the dispatcher to the frontend.
- 9. The user context is preserved for the next step, while the dialog process becomes available for another request.
Work Process Internal Services
A work process contains an ABAP processor, database interface, screen processor and task-handling functions. These components cooperate rather than acting as unrelated programs. The screen processor handles classic dynpro flow, the ABAP processor executes application logic, and the database interface manages supported database access and buffering integration. The task handler coordinates which component is active and the roll-in or roll-out of session context.
The operating-system process identity and SAP work-process number are useful for correlation with traces and host monitoring. However, an administrator should diagnose through the SAP status and reason first. High CPU, database time, memory consumption or elapsed time must be interpreted with the program, action, user and business purpose.
Dialog Work Process Time Controls
Interactive response protection commonly limits how long a dialog step should consume runtime before control mechanisms react. Historically, parameters such as rdisp/max_wprun_time have been used for maximum runtime behavior, but current releases can have additional class- or context-sensitive handling. The parameter is not a performance target and increasing it does not repair slow SQL or inefficient code. Before changing any runtime limit, identify the program, workload type, trace evidence and correct execution channel.
A genuinely long business task may belong in a background job, but moving it to background is not automatic remediation. The program can still monopolize database resources, hold locks or consume memory. Scheduling, variants, job class, server group and business window must be reviewed.
Background Processing Relationship
A background work process executes a job step selected by the background scheduler. SM37 is normally used to analyze job status, step, program, variant, target server, start condition and job log. A job waiting because no background process is free differs from a job that is active but blocked at the database or application layer. SM50 and SM66 show the runtime process; SM37 supplies the job context. Both views are required before intervention.
Update Processing in Detail
Applications register update function modules during the dialog portion of an SAP LUW. At COMMIT WORK, the update request is finalized and made available to update processing. The update work process executes the registered changes in a controlled database transaction. V1 updates are intended for primary, time-critical changes; V2 processing is used for less critical follow-on work where the application design supports it. The exact update design is application-controlled and must not be guessed from table changes alone.
A success message can mean that the dialog portion handed work to update processing; it does not always prove every downstream action has completed. When expected data is absent, record the transaction, user, client, timestamp and document reference, then analyze SM13 for the correct client and period. Preserve the error text and update module before reprocessing or deleting anything.
Safe Failed Update Analysis
- 1. Confirm the user, client, transaction, approximate time and missing business result.
- 2. Open SM13 and select the relevant client, user, time range and update status.
- 3. Open the matching request and record update header, module, error text and creation time.
- 4. Check ST22, SM21, database and application evidence for the same timestamp.
- 5. Determine whether the failure was temporary, caused by invalid business data, a program defect, a lock or an infrastructure problem.
- 6. Correct the owning cause through the application, development, database or BASIS process.
- 7. Reprocess only when the application owner confirms that repetition is safe and will not duplicate business activity.
- 8. Validate the business document, update status and absence of a recurring error.
SAP Logical Unit of Work and Database Boundaries
A database LUW normally ends with a database commit or rollback. An SAP LUW can span multiple user dialog steps because the business transaction must remain consistent while the user moves between screens. SAP logical locks protect the business object across those steps, and update processing groups the final durable changes. This design is necessary because work-process multiplexing means the same dialog process cannot hold one database transaction open during user think time.
COMMIT WORK is an application boundary. COMMIT WORK AND WAIT requests synchronous waiting for completion of high-priority update processing in supported application logic, while normal asynchronous update allows the dialog to continue after the handoff. Administrators should not insert commits, execute database commits or modify update-control tables as an operational shortcut.
Enqueue Architecture and Lock Communication
In classic R/3 explanations, lock management is shown as an enqueue work process in the central instance. Modern ABAP systems normally use an ABAP Central Services instance containing the message server and standalone enqueue server. Work processes send lock requests to the enqueue service, which maintains the central lock table in memory. High-availability architecture can include an enqueue replication server or the release-specific Standalone Enqueue Server 2 design.
Generated function modules named ENQUEUE_<object> and DEQUEUE_<object> are created from lock objects. The lock key, owner and mode determine whether requests conflict. A lock entry can be completely valid even when a user reports blocking. SM12 is used to inspect entries, but deletion is a recovery action, not routine cleanup. Confirm that the owning transaction, update or batch process has ended and that application recovery is understood before deletion.
Safe Lock Investigation
- 1. Record the blocked transaction, client, user, object or document key and exact time.
- 2. Use SM12 with the narrowest reliable selection and identify the lock argument, owner and age.
- 3. Determine whether the owner still has an active session, work process, job or update request.
- 4. Check whether the lock is progressing normally, waiting on another dependency or orphaned after failure.
- 5. Contact the lock owner or application team when business work may still be active.
- 6. Delete a confirmed stale lock only under an approved recovery procedure.
- 7. Repeat the original transaction and ensure that no competing update or data inconsistency was introduced.
Memory Areas and User Context
The historical roll-area model explains why user context can move between dialog work processes. In modern kernels, extended memory is normally the principal shared-memory area for user contexts, while private heap memory is process-local. Roll memory, paging and heap behavior remain release- and platform-sensitive. The allocation sequence and limits must be checked against current SAP documentation and the actual profile.
When a process enters private mode, it can retain heap memory and may no longer participate normally in shared dialog processing until the context ends. A high-memory process is not automatically defective; large internal tables, data selection, serialization, forms or application design can legitimately require memory. Diagnosis should correlate SM50 or SM66 with memory tools such as ST02, ST06, STAD, workload analysis and developer traces according to authorization and release.
Memory Diagnosis Questions
- Is the issue limited to one user, program, instance or time window?
- Did the process move into a private or memory-related state, and is memory still growing?
- Does the program select more data than intended or use an unusually broad variant?
- Are extended-memory limits, operating-system paging or host memory under pressure?
- Did a recent change, transport, kernel update or workload shift precede the symptom?
- Can the problem be reproduced safely with a smaller selection in non-production?
Buffer Types and Consistency
AS ABAP uses shared-memory buffers for repository and runtime information, including program-related, table, nametab and other kernel-managed content. ST02 provides a central starting point for buffer and memory-quality indicators. A low hit ratio, swaps or allocation pressure must be interpreted over an appropriate observation period and together with workload. A restart naturally begins with cold buffers and can temporarily increase database reads.
Table buffering behavior is defined in the ABAP Dictionary and depends on the buffering category. Generic, single-record and full buffering have different access patterns. Tables with frequently changing or unsuitable data should not be buffered merely to reduce database reads. Cross-instance invalidation is essential because every application server has its own local buffer state.
Resetting a buffer discards useful cached content and can create a database load spike while caches warm again. Use buffer resets only when SAP guidance or a confirmed inconsistency requires them, record the scope, and monitor database and application response afterward.
Database Interface and SQL Evidence
ABAP SQL statements pass through the database interface, which converts database-independent requests and integrates Dictionary metadata and supported buffering. Expensive response time may arise from large result sets, missing or unsuitable indexes, stale statistics, blocking, execution-plan change, network delay or database resource pressure. Work-process status alone cannot establish which cause applies.
For SQL analysis, correlate the transaction and timestamp with workload and SQL tools appropriate to the release, such as ST03N, STAD, ST05, SQL Monitor or database-native monitoring. A production SQL trace should be narrow, time-limited and approved because broad tracing can add overhead and collect sensitive statement values.
RFC and External Communication Waits
A dialog process can remain occupied while an application waits for a synchronous RFC, HTTP service, gateway program or another external dependency. Record the destination or action without exposing credentials. Check SM59 configuration and connection evidence, gateway or ICM traces, target availability and network timing as appropriate. Do not solve a remote-system outage by repeatedly terminating caller processes or changing timeouts without ownership review.
Spool Processing Relationship
Spool processing contains several layers: creation of an SAP spool request, conversion or formatting, transfer to the host spool system and physical device delivery. SP01 supplies request and output-request evidence, while SPAD contains output-device administration. A spool work process can be healthy even when the host spooler or printer is unavailable. Conversely, an application can fail before creating any spool request.
Monitoring the Runtime
SM51 Server Overview
SM51 lists active application server instances registered through the message server. It is the starting point for confirming whether the expected servers are visible and for navigating to instance-specific functions. Missing registration may indicate an instance, network or message-server problem.

Screenshot 2.3 - Application server overview in SM51
SM50 Local Work Process Overview
SM50 shows the work processes for the current application server instance. Useful fields include process type, status, reason, user, program, action and elapsed runtime. Available functions can affect active processing, so display analysis should come before any administrative action.
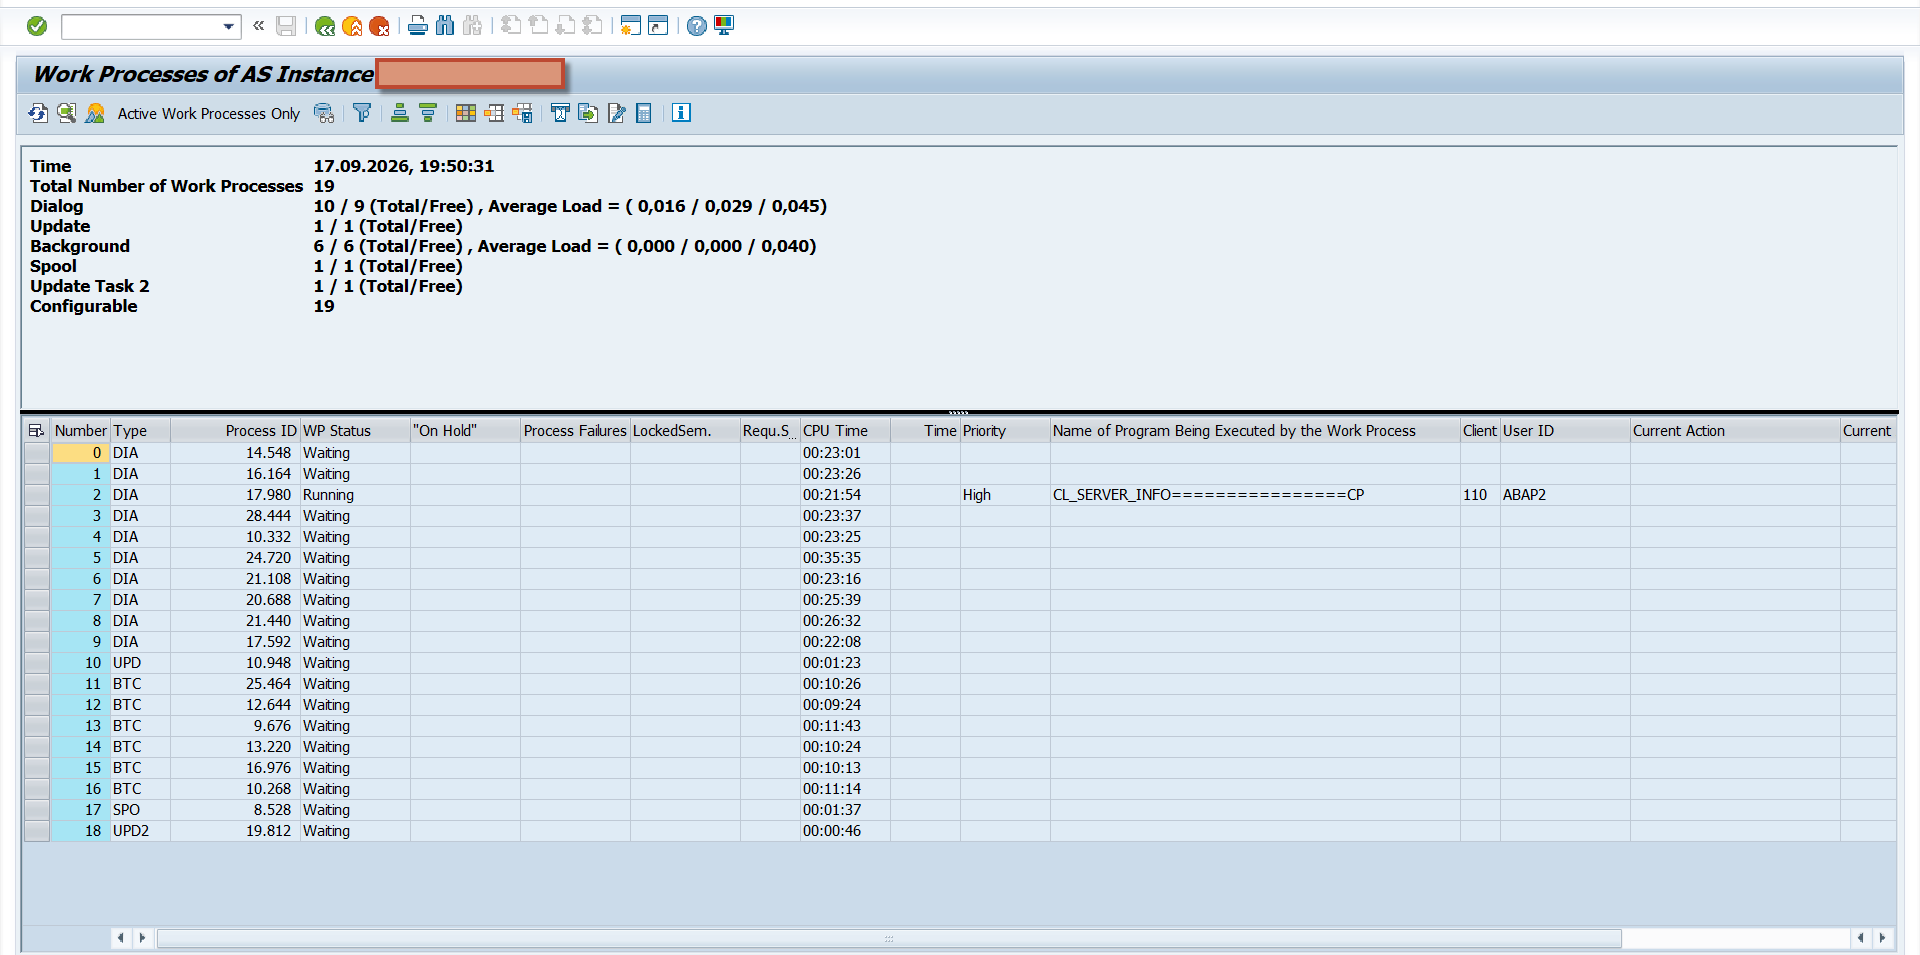
Screenshot 2.4 - Local work-process analysis in SM50
SM66 Global Work Process Overview
SM66 provides a system-wide view of work processes and is useful when the affected instance is unknown or when a comparison across instances is required. Use it to identify concentration of long-running activity, but move to the relevant local or detailed evidence before intervention.
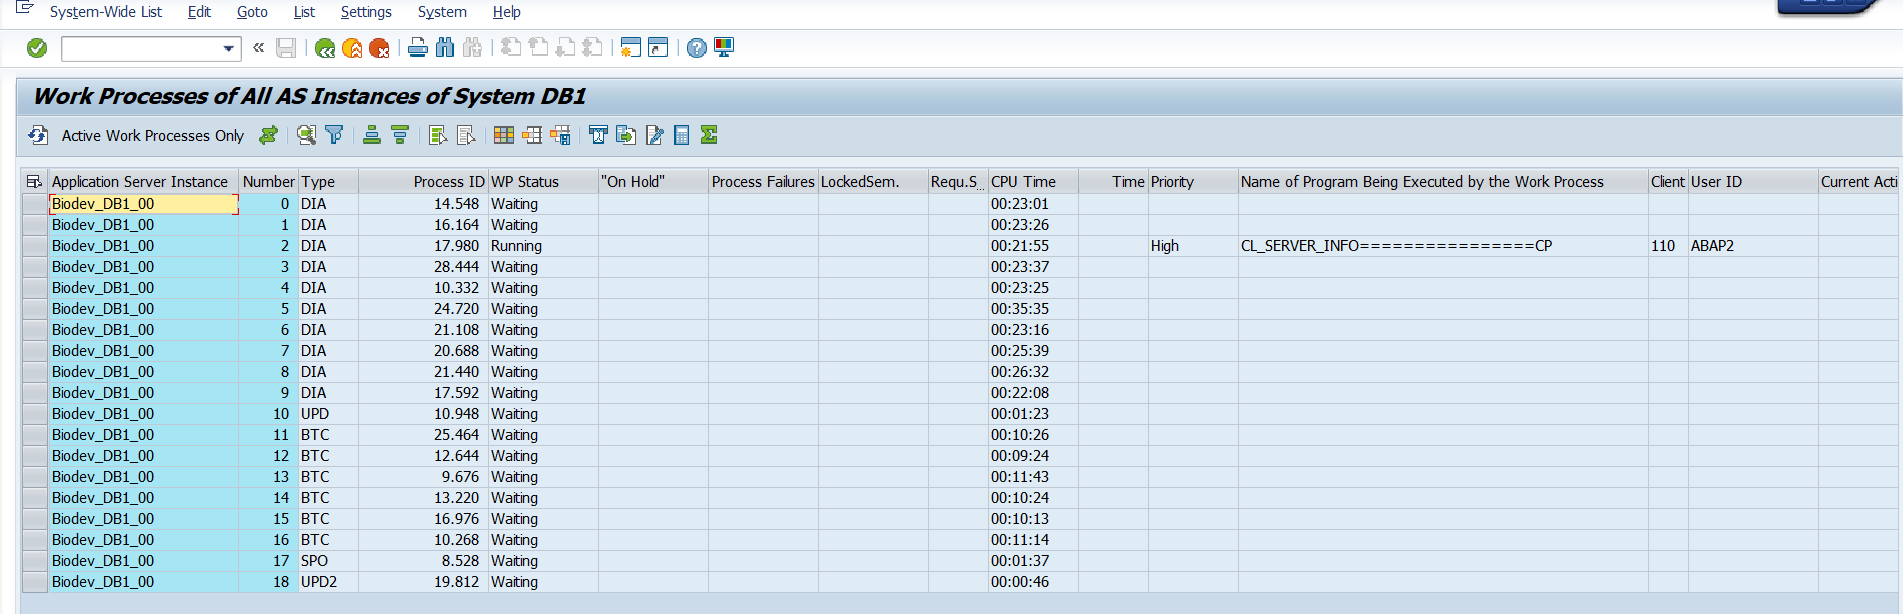
Screenshot 2.5 - System-wide work-process analysis in SM66
What to Record Before Acting
Capture the SID, client, timestamp, instance, process number, process type, status, reason, user, report or program, action and reported business symptom. Also record whether one user, one instance or the whole system is affected. Passwords and sensitive business values must never be included in evidence.
These transactions answer different runtime questions.
| Transaction | Scope | Question answered | Evidence to capture |
| SM51 | Active application server instances | Is the expected instance registered | Server host instance and registration scope |
| SM50 | Work processes on the current instance | What is each local process doing | Type status reason user program action runtime |
| SM66 | System-wide active work processes | Is the problem concentrated or system-wide | Instance process user program action runtime |
| SM12 | SAP logical lock entries | Who owns the lock and what object is protected | Client user time table or lock argument |
| SM13 | Update records and failures | Did asynchronous update succeed | User time status transaction and error |
Safe Administration Procedures
Analyze a Busy Work Process
A busy process should be classified before it is stopped. Confirm whether it is progressing, waiting for a database operation, held by a lock, communicating externally or consuming unusual resources. Contact the business or job owner when an active process may hold unsaved work.
Use this non-destructive sequence before any termination:
- Confirm the user report system client and exact time window.
- Open SM66 to determine whether the activity is local or system-wide.
- Open SM50 on the affected instance and record process type status reason user program action and elapsed time.
- Check whether the process is progressing or waiting on database lock RFC or another dependency.
- Contact the job or business owner when unsaved or critical work may be affected.
- Collect related dump system-log job update or database evidence.
- Choose the least disruptive approved action and record the decision.
- Repeat the original test and confirm process and queue recovery.
Investigate a Dispatcher Queue
Queue analysis begins with scope and timing. Confirm which queue is growing, whether suitable work processes are all occupied, and what those processes are doing. Compare another healthy instance and correlate with database, lock, RFC and system-log evidence.
Analyze queue pressure in this order:
- Identify the affected instance queue and observation period.
- Count available and occupied work processes of the required type.
- Group active processes by status reason program action or dependency.
- Compare the same evidence on another instance.
- Correlate with database locks RFC jobs updates and system log events.
- Decide whether the cause is demand blocked work failed dependency or configuration.
- Apply only the approved correction supported by the evidence.
- Monitor the queue and user response after the change.
Validate an Instance After Restart
After a controlled restart, confirm that the instance registers in SM51, expected work-process types are running, users can log on through the approved path and a safe display transaction completes. Validation should include the component that caused the restart, not only a green process list.
Record the following validation results:
- Instance is visible and correctly identified in SM51
- Expected dispatcher gateway ICM and central-service relationships are healthy
- Configured dialog background update and spool processes are running
- Approved direct and group logon paths work
- A safe display transaction completes
- Update spool RFC or interface checks related to the incident pass
- System log dumps and developer traces show no recurring startup error
Security and Operational Controls
Authorization and Privacy
Transactions such as SM50 and SM66 reveal technical activity, user IDs and program names. Access should be limited to authorized support roles. Evidence shared outside the support group must be sanitized according to policy.
Production Change Discipline
Parameter changes, work-process changes, instance restarts and lock or update interventions require approved production procedures. Define the expected result, monitoring window and rollback or recovery method before the action.
Terminating a Process Safely
Ending a process can interrupt a user transaction, background job, update or spool action. First identify the owner and business impact, preserve diagnostic evidence and use the least disruptive supported action. If the process is operating-system level or unresponsive, follow the escalation and restart procedure rather than improvising.
Common Errors and Solutions
Dispatcher and Work Process Errors
Runtime symptoms must be separated into capacity, application, database, lock and communication causes. The same visible complaint can have different causes on different instances.
Separate the visible runtime symptom from the underlying dependency.
| Error / symptom: Dialog queue continues to grow | |
| Symptom | Users wait for free dialog work processes and the dispatcher queue rises instead of clearing. |
| Possible causes | Long-running dialog requests, database waits, RFC/enqueue dependencies, too few available DIA processes, or an abnormal workload surge. |
| Detailed diagnosis | 1. Confirm the trend and affected instance, not a single sample. 2. In SM50/SM66 group processes by status, reason, program, action and elapsed time. 3. Correlate with ST03N/STAD, database and host metrics. 4. Identify whether many requests share one program, lock, RFC destination or SQL symptom before changing capacity. |
| Corrective solution | Remove the verified bottleneck: tune/correct the responsible program or SQL, restore the dependent service, reschedule unsuitable work, or use an approved temporary capacity/operation-mode action. Terminate a request only with owner approval and after impact/evidence checks. |
| Production precaution | Do not increase work processes blindly; extra processes can intensify CPU, memory or database contention. Capture evidence before restart or termination. |
| Validation | Queue length returns toward baseline, response time improves, new dialog steps are dispatched normally, and host/database utilization remains within agreed limits. |
| Error / symptom: One application-server instance is slow | |
| Symptom | Users or jobs routed to one instance are slow while the same workload is normal on another instance. |
| Possible causes | Local work-process saturation, host resource pressure, buffer behavior, filesystem/network problem, instance-specific configuration, or an unhealthy local dependency. |
| Detailed diagnosis | 1. Prove instance affinity using System Status, SM51, SM50/SM66 or STAD. 2. Compare the affected instance with a healthy peer for queue, process states, CPU, memory, paging, filesystem and buffer indicators. 3. Review instance traces and recent profile/kernel/configuration changes. 4. Repeat the same safe test on both instances. |
| Corrective solution | Correct the local resource, configuration or dependency issue. If operationally approved, drain/remove the unhealthy instance from logon groups while repairing it, then restore it only after technical and business validation. |
| Production precaution | Do not restart first; a restart erases transient evidence and may move the load to already busy peers. Confirm remaining capacity before draining an instance. |
| Validation | The same transaction performs comparably across instances, no abnormal local queue/process state returns, and the repaired instance remains stable after rejoining load balancing. |
| Error / symptom: All dialog work processes show Running | |
| Symptom | Every DIA process is occupied for an extended period and users cannot obtain timely dialog service. |
| Possible causes | Legitimate peak load, runaway application logic, expensive SQL, lock/RFC waits reported as active work, or unsuitable mass processing in dialog mode. |
| Detailed diagnosis | 1. Record elapsed time, user, client, program, action and reason. 2. Separate CPU-active work from database/RFC/enqueue waits. 3. Correlate common programs and users with workload and dump/system logs. 4. Contact the application owner for business context before any cancellation. |
| Corrective solution | Address the dominant cause: tune SQL/application logic, move authorised mass work to background scheduling, restore the waiting dependency, or cancel only the approved offending request. Apply emergency capacity changes only under the operations change process. |
| Production precaution | Never mass-cancel DIA processes. A running process can hold an LUW, lock or update-critical context; cancellation may cause rollback and user/business impact. |
| Validation | Free DIA capacity reappears, dispatcher waits decline, affected transactions complete, and no repeated saturation or related dumps/rollbacks occur. |
| Error / symptom: Work process repeatedly restarts | |
| Symptom | A work-process PID changes repeatedly, status cycles through restart, or dev_w* traces show recurring termination. |
| Possible causes | ABAP runtime failure, native/kernel crash, memory/resource exhaustion, database connectivity loss, operating-system signal, or defective external component. |
| Detailed diagnosis | 1. Record instance, process type/number, PID and exact times. 2. Preserve matching dev_w*, dispatcher, system log and ST22 evidence before rotation. 3. Check OS/database events and resource exhaustion at the same timestamps. 4. Determine whether the crash follows one user/program or affects arbitrary requests. 5. Verify kernel/patch information before escalation. |
| Corrective solution | Correct the identified program, resource, database/network or kernel/component fault using the approved fix and maintenance process. Quarantine a reproducible workload if necessary. Restart the instance only when the recovery runbook calls for it and evidence is already secured. |
| Production precaution | Do not repeatedly restart or delete traces; this hides the root cause. Kernel/library replacement and parameter changes require compatibility checks and rollback planning. |
| Validation | The affected work process remains stable through the previous reproduction window, no new matching trace/dump appears, and normal workload completes. |
| Error / symptom: Process waits on RFC or an external call | |
| Symptom | A work process remains occupied with an RFC/CPIC/external-call action and elapsed time continues to rise. |
| Possible causes | Remote system unavailable or slow, gateway/network problem, destination misconfiguration, authentication/certificate failure, exhausted remote capacity, or application timeout design. |
| Detailed diagnosis | 1. Identify the exact destination/called system, caller program and business request. 2. Check destination/gateway/queue evidence and remote-system health using approved tools. 3. Correlate timestamps on both systems. 4. Distinguish connection setup, authentication and slow remote execution. 5. Check whether retries are multiplying load. |
| Corrective solution | Restore the remote dependency or network path, correct destination/security configuration through change control, stop an unsafe retry source, or tune the application timeout/retry design with its owner. Cancel the caller only when rollback and duplicate-processing consequences are understood. |
| Production precaution | A successful connection test does not prove the business call is fast. Do not expose credentials in traces or repeatedly test a failing productive interface. |
| Validation | The real RFC/business call completes within its expected time, queues/backlogs drain without duplicates, and both local and remote monitoring remain normal. |
| Error / symptom: Long process appears idle | |
| Symptom | A process has high elapsed time but little visible activity, leading operators to suspect it is hung. |
| Possible causes | Legitimate wait for lock, RFC, database, frontend input or scheduler event; paused debugging; dead dependency; or a truly non-progressing program. |
| Detailed diagnosis | 1. Read status, reason, action and wait context rather than elapsed time alone. 2. Take repeated samples to see whether action/CPU/database activity changes. 3. Check owner, job/user context, locks and dependent systems. 4. Contact the business/application owner and review logs before classifying it as hung. |
| Corrective solution | Resolve the underlying wait or allow legitimate work to finish. If evidence confirms no progress and cancellation is approved, terminate the specific request using the safest transaction-level method, then address the program/dependency cause. |
| Production precaution | Do not kill the operating-system process as the first action. It can affect an LUW, lock, update or shared service and loses application-level context. |
| Validation | The request completes or cancels cleanly, locks/updates are consistent, and a controlled rerun progresses without the same wait. |
Lock Update and Buffer Errors
Lock, update and buffer symptoms are often consequences of another event. Preserve the owner, timestamp and application context before cleanup so that the correction does not destroy the best evidence.
Preserve context before cleanup or reset actions.
| Error / symptom: Object is locked | |
| Symptom | A user cannot change an object because an enqueue lock already exists. |
| Possible causes | Another active SAP LUW, abandoned session, long transaction, failed client/session disconnect, or application logic retaining a lock. |
| Detailed diagnosis | 1. Identify lock object/key, owner, client, transaction and age in SM12. 2. Ask the owner whether work is active. 3. Check related user/session, job, update and system-log context. 4. Determine business impact of removing the exact lock and whether the underlying LUW can still update data. |
| Corrective solution | Let valid work finish or have the owner exit/rollback normally. Remove only a confirmed orphan lock with business and BASIS approval, after verifying that no active LUW/update can later commit against the same object. Correct recurring application/session issues separately. |
| Production precaution | Never delete all locks or remove a lock merely because it is old. Forced deletion can permit conflicting updates and data inconsistency. |
| Validation | The intended transaction proceeds, no conflicting update appears, related SM13 records are consistent, and the same orphan lock does not recur. |
| Error / symptom: Update terminated | |
| Symptom | The user receives an update termination and an update record is marked failed in SM13. |
| Possible causes | Application exception, database error, lock conflict, missing data/authorization, resource failure, or invalid customizing during V1/V2 update processing. |
| Detailed diagnosis | 1. Record user, client, transaction, update key, time and error text in SM13. 2. Correlate ST22, SM21 and database/application logs. 3. Determine whether the business document committed partially or not at all. 4. Fix the root cause and obtain application-owner guidance on repeatability/idempotency. |
| Corrective solution | Correct the code, data, lock, database or customizing cause. Repeat the failed update only when the application owner confirms it is safe and duplicate/partial posting checks are complete; otherwise re-enter the business transaction using the approved recovery procedure. |
| Production precaution | Do not blindly repeat or delete failed updates. Financial/logistics updates may already have dependent or partial effects that require reconciliation. |
| Validation | The recovered or re-entered transaction posts once, the failed record is resolved according to policy, document consistency checks pass, and no new matching termination occurs. |
| Error / symptom: Data appears different by application-server instance | |
| Symptom | The same read shows different or stale-looking results depending on the application server. |
| Possible causes | Local buffer invalidation delay/problem, custom application cache, unsynchronised local file/state, timing between commit and read, or test sessions using different clients/parameters. |
| Detailed diagnosis | 1. Prove the instance, client, user inputs and exact timestamp for both results. 2. Verify the committed database value with the application owner. 3. Review relevant buffer statistics/invalidation and recent transports/customizing changes. 4. Determine whether the data is SAP-buffered, application-cached or read from a local resource. |
| Corrective solution | Correct the invalidation/cache design or instance-local dependency. Use a narrowly scoped, approved buffer reset only when SAP/application guidance identifies the affected buffer and business impact is understood; otherwise allow standard synchronisation/reload behavior. |
| Production precaution | Do not perform broad buffer resets in production as a diagnostic shortcut; they can create load spikes and hide the actual invalidation defect. |
| Validation | Repeated reads on multiple instances return the same committed value, buffer/load metrics remain healthy, and consistency survives the next controlled data change. |
| Error / symptom: High buffer swaps or poor hit behavior | |
| Symptom | Buffer monitoring shows sustained swaps, evictions or an abnormal hit ratio together with performance impact. |
| Possible causes | Undersized buffer, changed workload/object footprint, mass invalidation, memory pressure, inefficient buffering choice, or post-restart warm-up. |
| Detailed diagnosis | 1. Compare a sustained trend with the normal baseline; ignore a single post-start sample. 2. Identify the specific buffer and largest/churning objects. 3. Correlate swaps with memory, paging, workload, transports and restarts. 4. Check release-specific SAP guidance and total instance memory before proposing sizing. |
| Corrective solution | Correct abnormal invalidation or object usage first. If evidence supports sizing, change only the relevant profile parameter through change control, confirm available memory, restart only when required, and monitor the full business cycle. |
| Production precaution | Increasing one buffer reduces memory available elsewhere and may cause paging. Do not chase a universal hit-ratio target without workload context. |
| Validation | Sustained swaps and response-time impact fall during comparable workload, hit behavior stabilises after warm-up, and OS/instance memory remains safe. |
| Error / symptom: Spool output remains waiting | |
| Symptom | A spool request stays waiting/in process or does not reach the expected printer/output device. |
| Possible causes | No available spool work process, stopped/incorrect output server, host spooler or device unavailable, access method/configuration error, or frontend printer dependency. |
| Detailed diagnosis | 1. In SP01, inspect request/output status and error log. 2. Identify output device, output server, access method and host spool request. 3. Verify the assigned spool work process/server and OS/print service. 4. Test with an approved small document and distinguish SAP spool creation from physical printing. |
| Corrective solution | Restore the assigned output server/host spooler/device, correct SPAD configuration through controlled administration, or reroute to an approved device. Reprocess only after determining whether the original output may still print. |
| Production precaution | Avoid repeatedly releasing output; delayed requests can all print later and expose sensitive or duplicate documents. Never use confidential production content for a diagnostic print. |
| Validation | A controlled request moves through completed status, prints exactly once at the authorised device, and the original backlog drains without duplicates. |
| Error / symptom: Background job delays dialog users | |
| Symptom | Interactive response time degrades during a batch job window and recovers when the workload ends. |
| Possible causes | Job consumes CPU/database I/O/memory, holds locks, runs with excessive parallelism, performs inefficient SQL, or overlaps another heavy workload. |
| Detailed diagnosis | 1. Correlate SM37 job steps/times with ST03N/STAD, database and host metrics. 2. Identify program, variant, parallel tasks, SQL and locks. 3. Compare with a normal run and quantify dialog impact. 4. Confirm the business deadline and dependencies with the job owner. |
| Corrective solution | Tune the program/SQL/variant, reduce approved parallelism/package size, move the job to a lower-contention window, or use workload management consistent with system design. Cancel/reschedule only with job-owner approval and restartability checks. |
| Production precaution | Do not simply add background processes; this can increase database/CPU contention. Confirm whether cancellation causes partial processing or requires cleanup. |
| Validation | The job finishes within its batch window, dialog response meets baseline/SLA during execution, resource peaks are acceptable, and output/data completeness checks pass. |
Diagnostic Decision Process
Start with scope, then trace the request through instance, dispatcher, work process, lock or database dependency. Change one layer only when the evidence supports it, and repeat the original business test after recovery.
Use this decision sequence during a runtime incident:
- Define the business symptom affected users systems clients and time window.
- Use SM51 to confirm the expected instances and determine whether one server is missing.
- Use SM66 for system-wide scope and SM50 for local process detail.
- Classify the dominant state as running database wait lock wait RFC wait update spool or another dependency.
- Collect the corresponding log dump trace job lock update or database evidence.
- Correct the owning layer through the approved procedure.
- Repeat the original business action and compare process and queue behavior.
- Document the cause action validation and preventive follow-up.
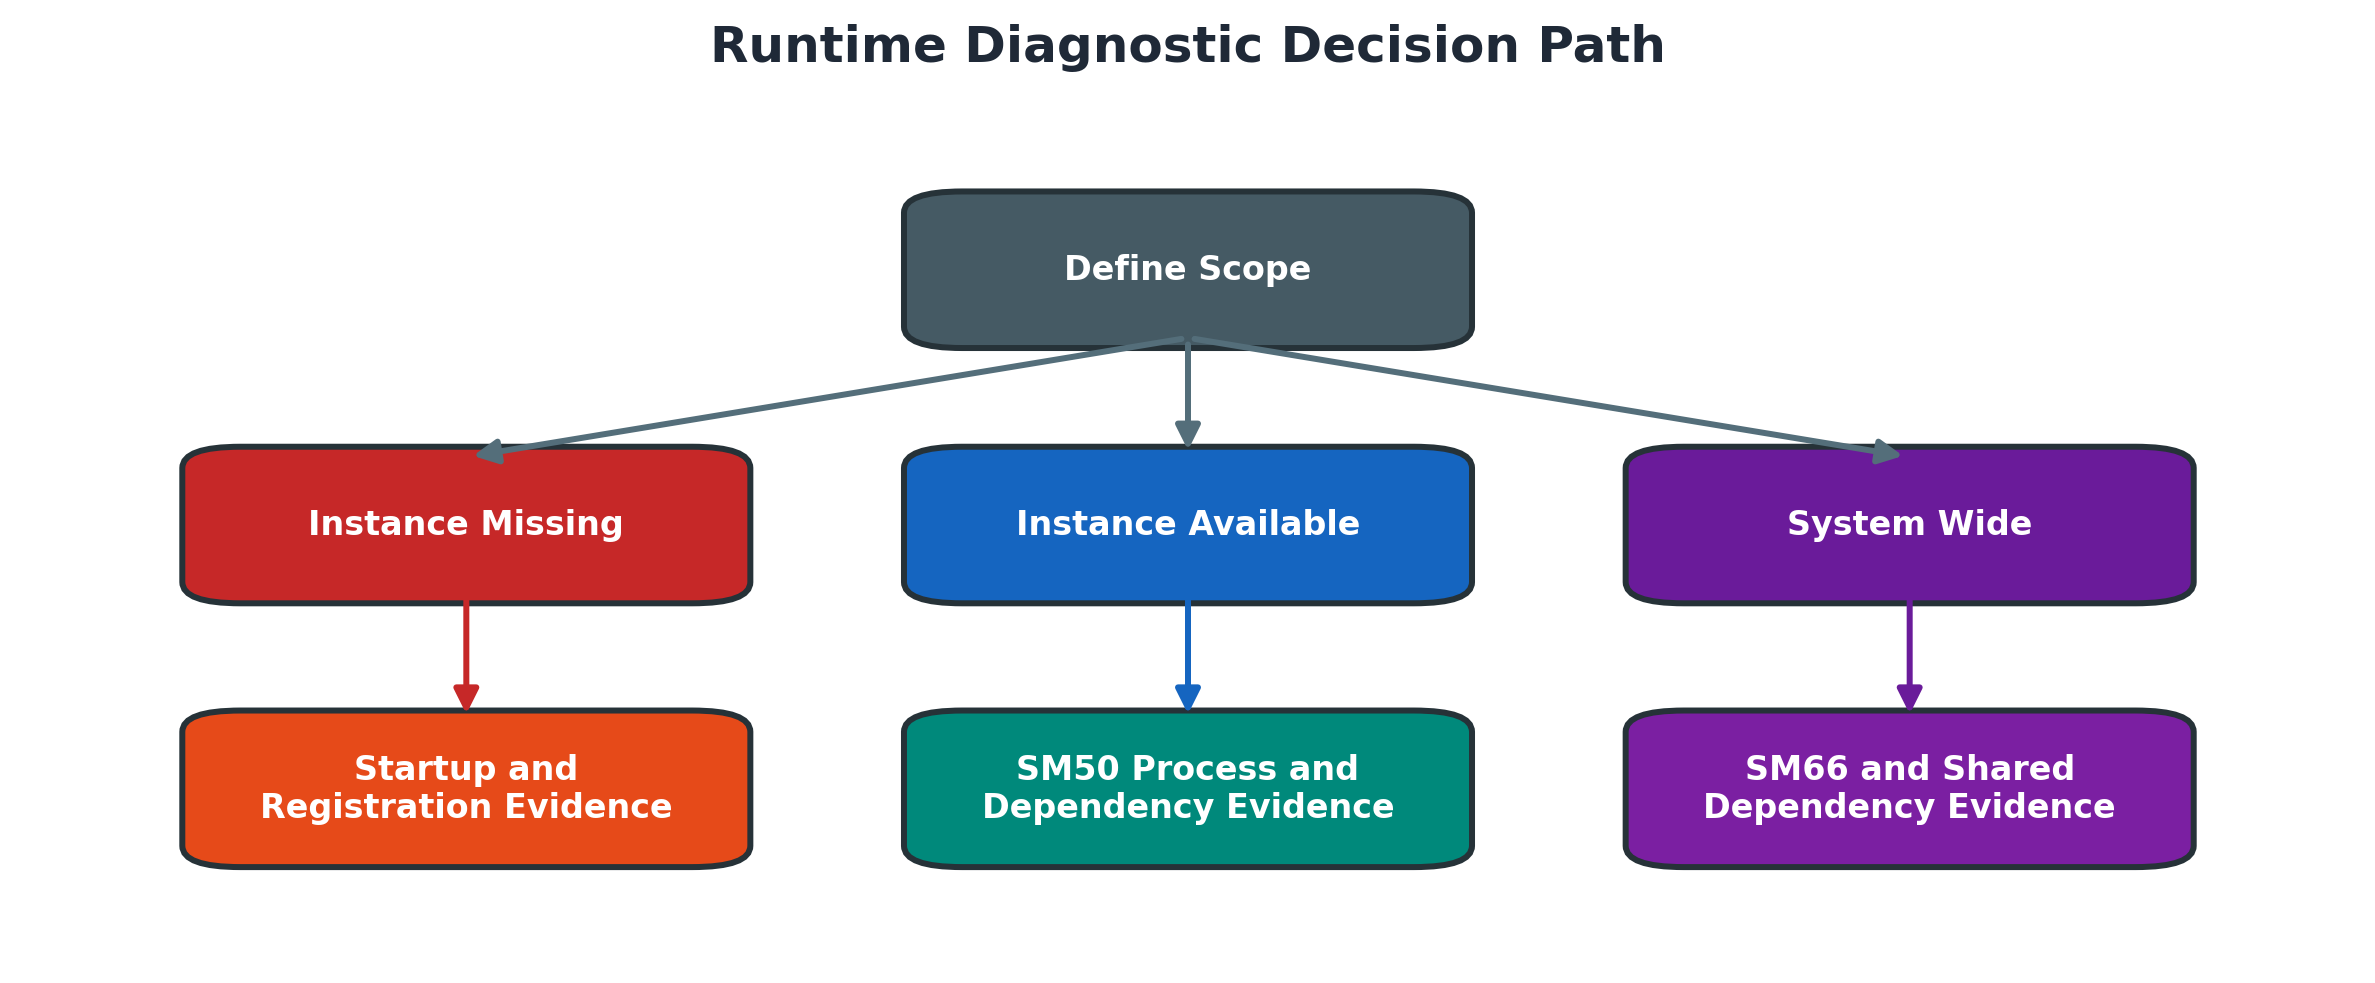
Figure 2.5 Runtime troubleshooting path
Detailed Error Resolution Runbooks
The following runbooks expand the quick-reference error tables. Transaction names and visible states can vary by release, authorization and UI technology. Begin with display evidence, preserve the original timestamp and confirm the business impact before changing runtime state.
All Dialog Work Processes Are Busy
Symptom: Users on one or more instances wait for screens, receive timeout-related messages or see very slow response while dialog queues rise. SM50 or SM66 shows few or no free dialog processes.
Likely causes: Several long-running reports are using dialog processes, a database or RFC dependency is slow, processes are waiting for locks, a program loops or consumes excessive resources, or workload distribution sends too much traffic to one instance. A recent reduction of dialog capacity or incorrect operation mode can contribute.
Diagnosis: Determine whether the issue is local or system-wide with SM51, SM66 and instance-specific SM50. Group occupied processes by status, reason, program, action and elapsed time. Correlate database waits with database monitoring, RFC waits with destinations and target evidence, and lock waits with SM12. Review operation mode and work-process configuration without changing them during evidence collection.
- 1. Record affected users, instance, client and start time.
- 2. Capture SM66 system-wide evidence and SM50 details on the busiest instance.
- 3. Identify whether most processes share one program, user, action or wait reason.
- 4. Check SM21, ST22, STAD or workload, database, RFC, lock and job evidence for the same window.
- 5. Contact business or job owners before stopping active work.
- 6. Correct the owning dependency or workload; terminate only a confirmed harmful process under approval.
- 7. Monitor queue recovery and repeat the original transaction.
Production precaution: Adding processes or increasing runtime limits without sizing can move pressure to memory, CPU or the database. Mass process termination can lose user work and hide the root cause.
Validation: Dialog processes become available, queues return to their normal range, the original business action completes and no related update, job or data inconsistency remains.
One Work Process Runs for an Unusually Long Time
Symptom: One SM50 or SM66 entry shows a long elapsed time, high CPU, a repeated action or a persistent wait. Other users may or may not be affected.
Likely causes: A valid long report, inefficient selection, expensive SQL, database blocking, synchronous RFC wait, lock wait, memory-intensive ABAP code, endless loop or debugging/session state.
Diagnosis: Do not classify the process as hung based only on elapsed time. Record process type, status, reason, user, client, report, action and CPU or database context. Determine whether counters or action change over repeated observations. Check job context in SM37 for background work and contact the owner for interactive work. Use approved trace or runtime analysis only when necessary and narrowly scoped.
Corrective solution: Resolve the database, lock, RFC or target-system cause when the process is waiting. For a code defect, preserve dump or trace evidence and engage development. Cancel through the application or job interface where possible; use work-process termination only as an approved last resort.
Validation: The process ends or progresses normally, dependent queues clear, the owner confirms the outcome and the same workload succeeds after the underlying correction.
Dispatcher Queue Continues to Grow
Symptom: Dispatcher queue monitoring shows sustained growth and users experience delayed request assignment.
Likely causes: All compatible processes are occupied, workload is concentrated on one server, a shared dependency slows many processes, process count or operation mode is unsuitable, or the instance has host-level resource pressure.
Diagnosis and solution: Compare arrival and service behavior over time. Identify the queue type, suitable work-process count and current process reasons. Compare a healthy instance. Correct the shared dependency or workload distribution first. Capacity changes require sizing, profile control and usually a planned restart or supported operation-mode change. Do not clear a queue as a substitute for processing its requests.
Validation: Queue depth falls without recurring growth, response time normalizes and host, database and work-process utilization remain within the accepted operating range.
Work Process Is in PRIV Mode or Shows Memory Pressure
Symptom: A dialog process enters private mode, consumes large process-local memory, or an allocation failure or memory-related dump occurs.
Likely causes: Large internal tables, very broad selections, application memory retention, insufficient extended memory, heap transition, operating-system memory pressure or an inappropriate parameter configuration.
Diagnosis: Record the user, program, action, selection volume, instance and time. Review ST22 for memory-related dumps, ST02 for memory and buffer indicators, ST06 for host memory and paging, and relevant workload or trace evidence. Compare with the same program and smaller selection. Confirm actual profile values and release-specific allocation sequence before recommending parameter changes.
Corrective solution: Reduce the selection or correct the program when application demand is excessive. Address host or parameter capacity only after sizing and SAP-supported review. A controlled restart can release memory but is not a root-cause fix. Schedule large workloads in a suitable channel and window when appropriate.
Validation: The workload completes with controlled memory use, dialog capacity remains available, no new memory dump appears and operating-system paging remains acceptable.
Update Request Is Terminated in SM13
Symptom: The user received a completion or update message, but business data is missing or inconsistent; SM13 contains a terminated update request.
Likely causes: Invalid business or configuration data, application exception, duplicate key, database error, lock conflict, resource outage or an update-process failure.
Diagnosis: Select the exact client, user and time. Record the update module and error. Correlate ST22, SM21 and database evidence. Determine whether the business transaction can be safely repeated and whether partial downstream activity exists.
Corrective solution: Fix the owning application or technical cause first. Reprocess only with functional approval and a documented duplication check. If the application provides a specific recovery transaction, use it instead of manual table correction.
Production precaution: Deleting the update record destroys evidence; blind reprocessing can create duplicate postings, documents or interface messages.
Validation: The update completes, the expected document or state exists once, related accounting or logistics follow-on results reconcile, and no new terminated request appears.
Update Work Processes Are Not Available
Symptom: Update requests accumulate, users report delayed persistence, or SM13 shows many records waiting while no healthy update capacity is visible.
Likely causes: Update processing has been deactivated, update work processes are stopped or occupied, the instance is unavailable, database connectivity has failed, or configuration does not provide suitable capacity.
Diagnosis and solution: Confirm the update system status, configured update processes, process state and system/database logs. Restore the failed dependency or instance through the approved procedure. Re-enable update handling only after the cause is understood. Review accumulated requests before releasing a large backlog because it can create a database load surge.
Validation: Update processes remain healthy, the backlog drains in a controlled manner, new requests complete and business reconciliation confirms consistency.
Lock Entry Blocks a Business Transaction
Symptom: The transaction reports that an object is locked by another user or process.
Likely causes: A valid concurrent transaction, a long-running update or batch job, a user session left open, an application error that did not release the lock, or an enqueue communication problem.
Diagnosis: Record the object key and blocking owner. In SM12 identify the exact lock and age. Check the owner in user/session monitoring, work-process overview, jobs and SM13. A recent lock with an active owner is normally valid. An old lock is not automatically stale.
Corrective solution: Allow or ask the owner to complete or cancel normally. Resolve the underlying job, update or communication failure. Delete only a verified orphaned entry after confirming the business recovery path.
Validation: The original action succeeds, no conflicting user update was allowed, and the lock is created and released normally on the next controlled test.
Enqueue Server or Lock Communication Is Unavailable
Symptom: Many transactions cannot set locks, enqueue-related errors appear, or the system shows a central lock-service failure.
Likely causes: ASCS or standalone enqueue server outage, communication or port failure, message-server or cluster issue, failover problem, or an enqueue resource/configuration error.
Diagnosis: Treat this as a system-wide consistency risk. Confirm ASCS process state and HA resource status, check instance and enqueue traces, network reachability and recent failover events. Do not restart individual application servers repeatedly when the central service is unavailable.
Corrective solution: Restore or fail over the enqueue service using the documented platform and SAP procedure. In replicated designs, verify the supported takeover state. Coordinate application recovery because active locks and in-flight transactions may have been affected.
Validation: All instances reconnect, controlled transactions can create and release locks, enqueue monitoring is healthy and business owners validate critical in-flight processing.
Buffer Swaps or Poor Buffer Quality in ST02
Symptom: ST02 shows swaps, pressure or a poor hit ratio, and workload may show increased database time.
Likely causes: Cold buffers after restart, undersized or fragmented areas, an application change, large repository activity, unsuitable table buffering or a workload shift.
Diagnosis: Observe the metric over a representative period, not immediately after restart. Identify the specific buffer, compare instances, review recent changes and correlate database load. Confirm whether the issue is stable, growing or a one-time warm-up effect.
Corrective solution: Correct unsuitable application or buffering design where applicable. Parameter resizing requires memory-budget review, current documentation and planned change control. Do not reset the buffer merely to remove the swap counter.
Validation: Buffer behavior stabilizes over the agreed period, database load does not worsen and user response improves without creating host-memory pressure.
Only One Application Server Is Slow
Symptom: Users connected to one instance are slow while the same function is normal on another instance.
Likely causes: Instance-local queue saturation, host CPU or memory pressure, cold or problematic buffers, a local route or RFC issue, an instance-specific profile difference, filesystem problem or unhealthy work processes.
Diagnosis: Verify the connected server with System Status. Compare SM50, ST02, ST06, profiles, traces and dependent network paths between slow and healthy instances. Check whether direct SAP Logon entries bypass normal load balancing.
Corrective solution: Repair the confirmed host, instance or route issue. Temporarily remove an unhealthy instance from user traffic only through the approved load-balancing and change process; do not distribute unofficial direct entries.
Validation: Both direct controlled testing and logon-group traffic succeed, instance metrics align with peers and the symptom does not follow users back to the repaired server.
Work Process Ends with a Short Dump
Symptom: The transaction terminates and ST22 records an ABAP runtime error.
Likely causes: Application exception, invalid data, authorization-related program behavior, memory exhaustion, database error, kernel/runtime inconsistency or custom code defect.
Diagnosis: Capture runtime error name, program, include, line, user, client and timestamp. Read the error analysis and system environment in ST22. Correlate with transport history, input conditions, database/system logs and whether standard or custom code is involved.
Corrective solution: Follow the dump-specific SAP or development remediation. Correct data only through the application-owned process. Apply code, note, kernel or configuration changes through normal testing and transport/change control.
Validation: The exact scenario completes without a new dump, regression testing passes and monitoring confirms no broader recurrence.
Synchronous RFC Wait Occupies Dialog Processes
Symptom: Many dialog processes show the same RFC-related action or wait and response depends on a remote system.
Likely causes: Target system outage or saturation, network latency, gateway issue, destination configuration, authentication failure or remote application delay.
Diagnosis: Identify the destination and target from approved technical evidence, check SM59 tests cautiously, correlate gateway/ICM and target logs, and determine whether the call is synchronous. Protect credentials and do not share connection data in screenshots.
Corrective solution: Restore the target or network path, correct approved destination configuration, or change application integration design through development if synchronous coupling is unsuitable. Timeout changes require end-to-end review.
Validation: Calls complete within the agreed response time, dialog capacity returns and retries do not duplicate remote processing.
Spool Request Remains in Error
Symptom: Output is not printed or delivered and SP01 shows an error or incomplete output request.
Likely causes: No spool process, output device configuration error, host spooler or printer unavailable, formatting/conversion failure, authorization issue or filesystem/resource problem.
Diagnosis: Separate spool request creation from output-request transfer. Record request number, output device, status and error. Check spool process state, SPAD configuration, host spooler and device reachability. Avoid repeatedly resubmitting confidential output.
Corrective solution: Restore the failed layer, correct output-device configuration through change control, and repeat only the affected output request when safe.
Validation: One intended output is produced, request status is correct, no duplicate confidential print exists and subsequent requests process normally.
Instance Missing from SM51
Symptom: An expected application server is absent from SM51 or logon groups no longer direct users to it.
Likely causes: Instance stopped, dispatcher startup failure, message-server registration problem, network or name-resolution failure, profile mismatch or host outage.
Diagnosis: Confirm host and SAP start-service state, dispatcher and work-process processes, developer traces, system log, database access and message-server connectivity. Determine whether the instance is repeatedly starting and failing. Do not rely only on an operating-system process snapshot.
Corrective solution: Repair the identified startup, database, profile, filesystem or communication failure, then start the instance through the approved procedure. Profile correction must be tested and documented.
Validation: The instance remains visible in SM51, has the expected work-process distribution, registers in the intended logon group and completes a controlled application test.
Practical Scenario
Slow Transaction on One Application Server
Users report that one transaction is slow after connecting through a direct SAP Logon entry, while colleagues using a load-balanced entry are unaffected. SM51 shows all instances registered. SM50 on the directly selected server shows most dialog processes waiting on the same external or database action, while another instance has available capacity.
The BASIS administrator records the affected server, user samples, process reasons and time window. The team confirms whether the dependency is database, RFC or application code, avoids terminating processes without owner approval, and tests the same transaction through the normal logon group after the dependency is corrected.
A safe response to this scenario is:
- Confirm which SAP Logon entry and application server the affected users reached.
- Verify all expected instances in SM51.
- Compare SM50 on the slow instance with SM50 on a healthy instance.
- Record the common status reason program action and elapsed time of affected dialog processes.
- Correlate the wait with database RFC lock or application evidence.
- Engage the owning team and apply the approved correction without destroying diagnostic evidence.
- Retest through the direct entry and the normal logon group.
- Record queue recovery user confirmation and any permanent tuning or scheduling action.
Expected Results and Validation
The original transaction completes within its accepted response range, dispatcher queues return to their normal pattern and dialog work processes are available on the affected instance. The administrator records the root cause, corrective action, validation evidence and any follow-up required for code, capacity or scheduling.
Summary
Key Takeaways
The dispatcher assigns queued requests to work processes; users do not own a dialog process for the full session. Instance-local queues and buffers explain why a problem can affect only one application server.
Data consistency depends on the combined behavior of application logic, SAP logical locks, database transactions and update processing. Safe administration starts with scope and evidence, not with process termination or buffer reset.
Retain these operating habits:
- Treat the dispatcher queue and work-process pool as one request-handling system.
- Remember that dialog steps from one user can run in different work processes.
- Differentiate instance-local problems from system-wide problems.
- Use process status and reason instead of elapsed time alone.
- Preserve lock update buffer and trace evidence before cleanup.
- Terminate work or reset runtime resources only through approved procedures.
- Validate recovery with the original business action.
Content Coverage Validation
This chapter independently covers the Week 1 runtime topics: kernel-facing services, dispatcher behavior, work-process types, dialog steps, multiplexing, user context, ABAP database access, shared-memory buffers, SAP locks, asynchronous update, server and process monitoring, and structured runtime troubleshooting.
The structure, wording, tables, examples and diagrams are original. The historical source was used for subject coverage, while modern enqueue architecture and administration terminology were checked against current official SAP documentation. Source screenshots and diagrams have not been copied or traced.