
BASIS - Week 1 Foundations Architecture and Core Operations / SAP System Monitoring and Performance Analysis | SAP BASIS
Result :
SAP System Monitoring and Performance Analysis | SAP BASIS
Introduction
Purpose
This chapter provides a practical method for monitoring an SAP ABAP system and investigating performance complaints without guessing. It connects user experience, SAP workload statistics, work processes, locks, memory, buffers, operating-system resources, database activity, traces and alerts into one evidence-based workflow.
The central rule is simple: record the affected time and scope first, then correlate the same interval across layers. A red indicator or high value is not a root cause until it explains the user impact and is supported by related evidence.
Who Should Read This Chapter
The chapter is intended for SAP BASIS administrators, operations engineers, technical architects, database teams and support analysts responsible for daily health checks, incident diagnosis and performance improvement.
Learning Objectives
After completing this chapter, the reader should be able to build a monitoring routine, interpret response-time components, use ST03N and STAD, analyze SM50 and SM66, review locks and updates, assess buffers and operating-system load, coordinate database analysis, work with RZ20 alerts and diagnose common performance failures safely.
The practical outcomes are:
- Design monitoring checks around service risk and ownership
- Break response time into meaningful components
- Use ST03N STAD SM50 and SM66 in the correct sequence
- Correlate SAP operating-system and database evidence
- Respond safely to locks updates dumps and traces
- Validate a performance correction against the original baseline
Scope and Version Context
The principles apply broadly to AS ABAP and SAP S/4HANA systems. Transaction screens and available metrics differ by SAP release, database, operating system and monitoring platform. In newer landscapes, SAP Focused Run, SAP Cloud ALM, Solution Manager or third-party tools may complement the classic transactions.
Never change profile parameters, terminate work processes, delete locks or activate broad traces only because one metric looks unusual. Compare with a known baseline, confirm business impact and follow approved production change procedures.
Build a Monitoring Strategy
Why Monitoring Needs a Method
Monitoring has two purposes: detect degradation before users are seriously affected and provide evidence when an incident occurs. Opening many transactions without a question creates noise. A useful check states what is being protected, which metric represents it, who owns the response and what action follows.
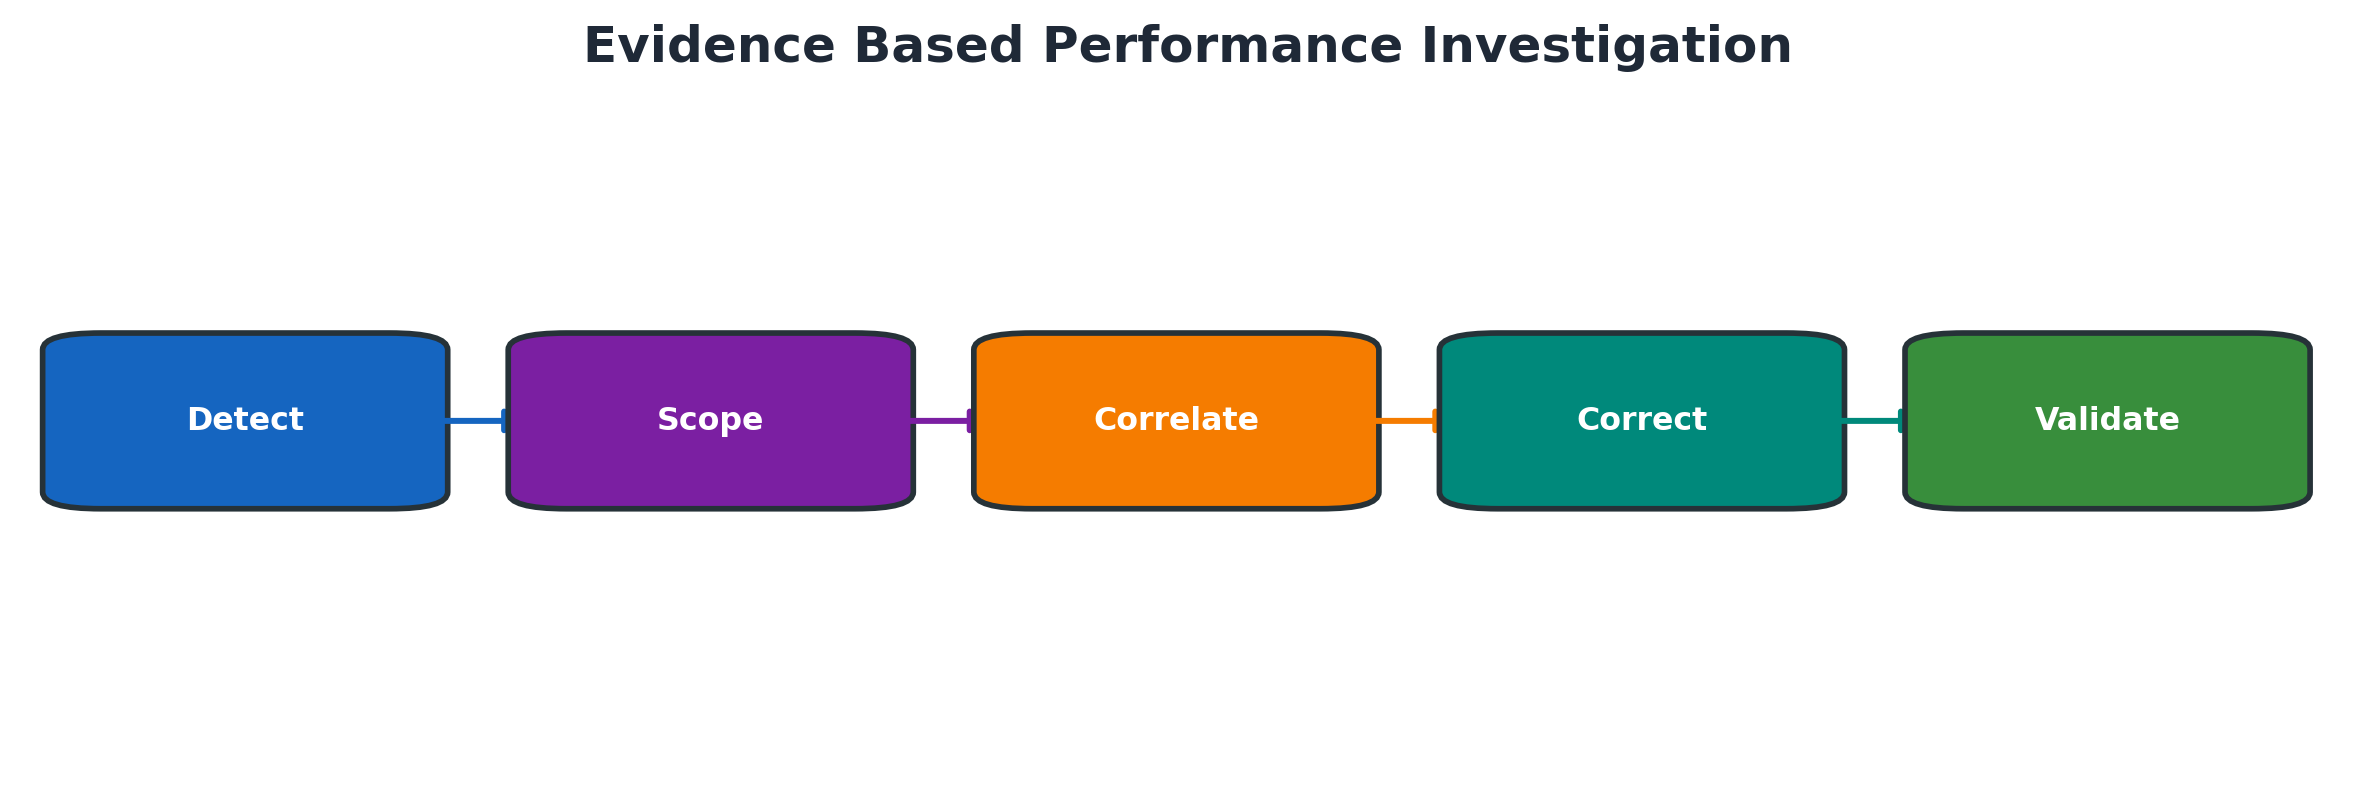
Figure 8.1 Evidence based performance investigation
Monitoring Layers
A user request crosses the frontend and network, dispatcher and work process, ABAP runtime, buffers, interfaces, database and host resources. A delay observed in one layer can originate in another. Correlation prevents the team from treating a symptom as the cause.
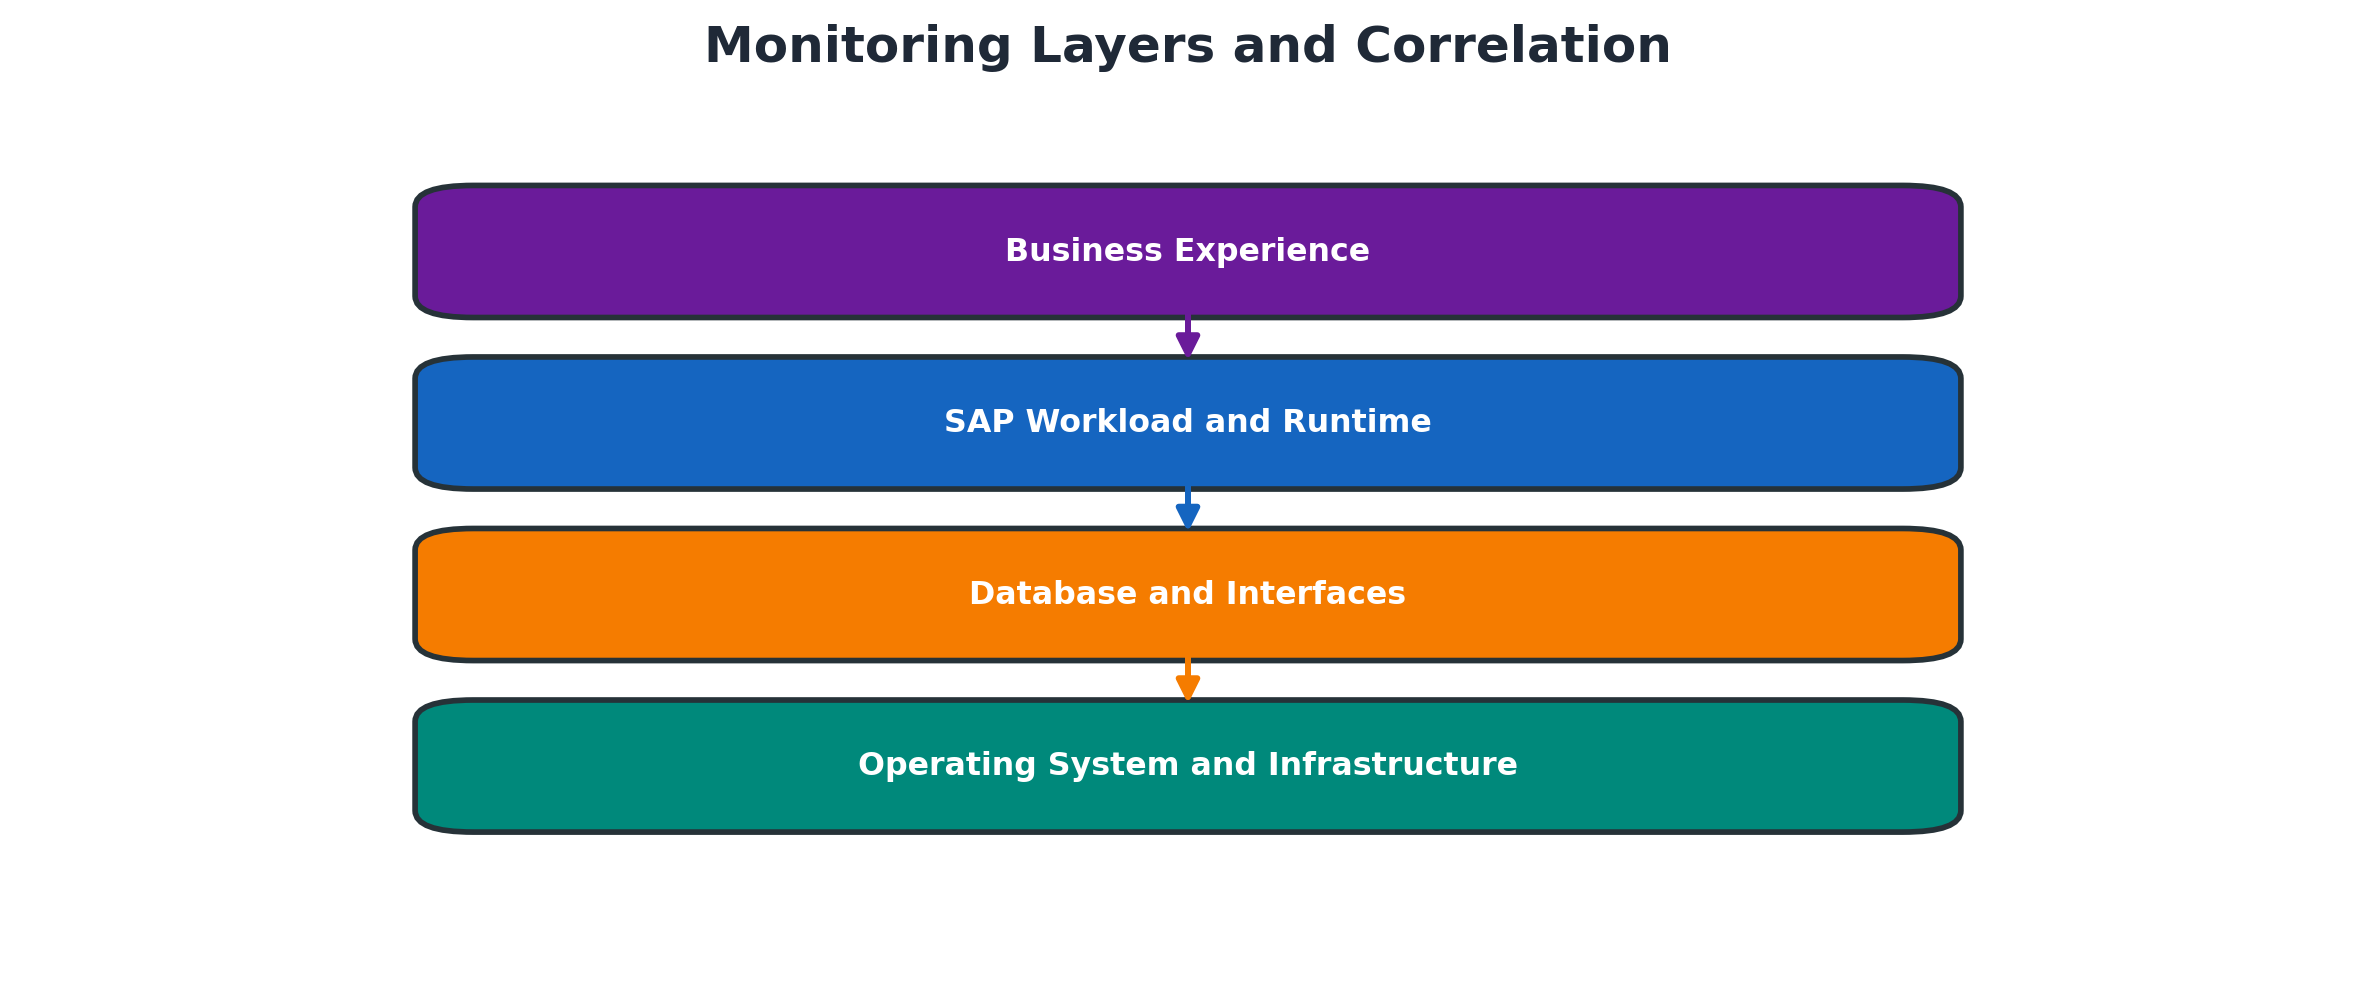
Figure 8.2 Monitoring layers and correlation
Baselines Thresholds and Ownership
A baseline records normal values for comparable business periods. Month-end, payroll, batch windows and ordinary daytime traffic should not share one blind threshold. Define warning and critical limits from capacity, service targets and observed healthy behavior, then assign an owner and escalation path.
A threshold is useful only when it has context and an owner.
| Element | Definition | Operational evidence |
| Baseline | Normal behavior for a comparable period | Hourly or daily trend by workload |
| Warning | Early condition requiring review | Documented review action |
| Critical | Service risk requiring prompt response | Runbook and escalation |
| Owner | Team responsible for diagnosis or correction | Named queue and contact path |
| Closure | Evidence that risk and impact are resolved | Before and after validation |
Daily Weekly and Monthly Checks
Daily checks focus on availability, failed jobs, dumps, system log, updates, locks, queues, filesystem and database health. Weekly reviews look for workload, growth and recurring errors. Monthly reviews assess capacity, peak usage, threshold quality and unresolved trends. Keep the checklist short enough to execute consistently.
Match check frequency to operational risk.
| Frequency | Primary checks | Outcome |
| Daily | Availability jobs dumps log updates locks queues filesystem database | Immediate exceptions assigned |
| Weekly | Workload trend recurring dumps growth interface and alert quality | Patterns and repeat issues identified |
| Monthly | Capacity peak periods baselines thresholds and unresolved problems | Monitoring and capacity plan improved |
Start with System Health
Instances and Services
Confirm that required application server instances and services are available before performing detailed performance analysis. Use SM51 for the application-server overview and the approved host or SAP start service tools for service status. Missing or recently restarted instances can shift load to the remaining servers.
Work Processes and Queues
SM50 shows work processes for one instance; SM66 provides a system-wide view. Look for sustained saturation, many processes in the same long-running action, repeated errors, PRIV mode, stopped processes or a growing dispatcher queue. A momentary snapshot must be compared with repeated observations and workload history.
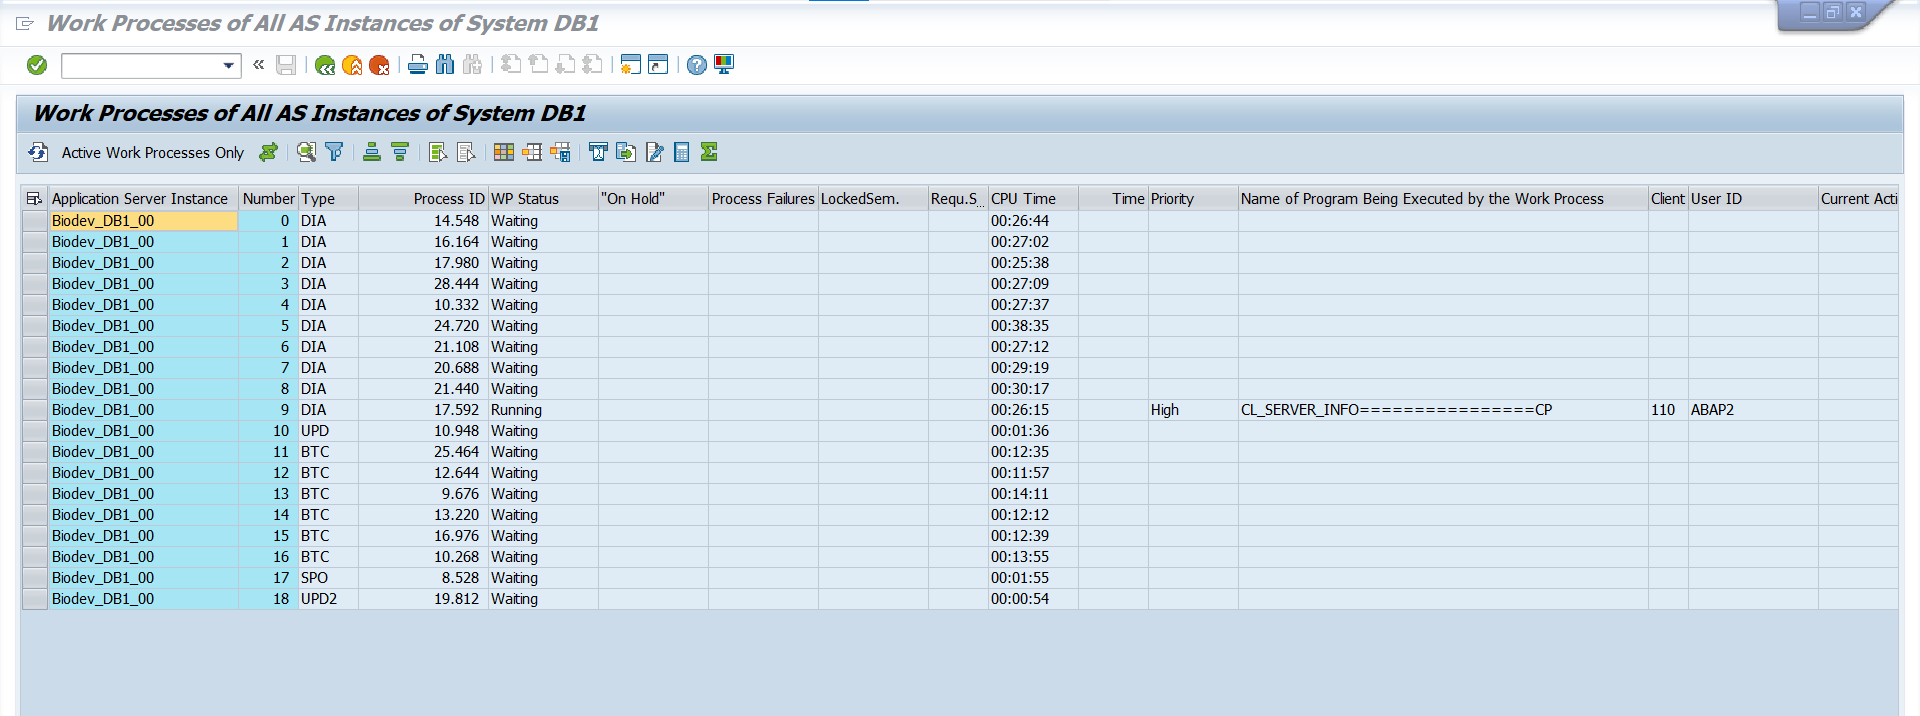
Screenshot 8.1 - System Wide Work Process Overview in SM66
Active Users and Sessions
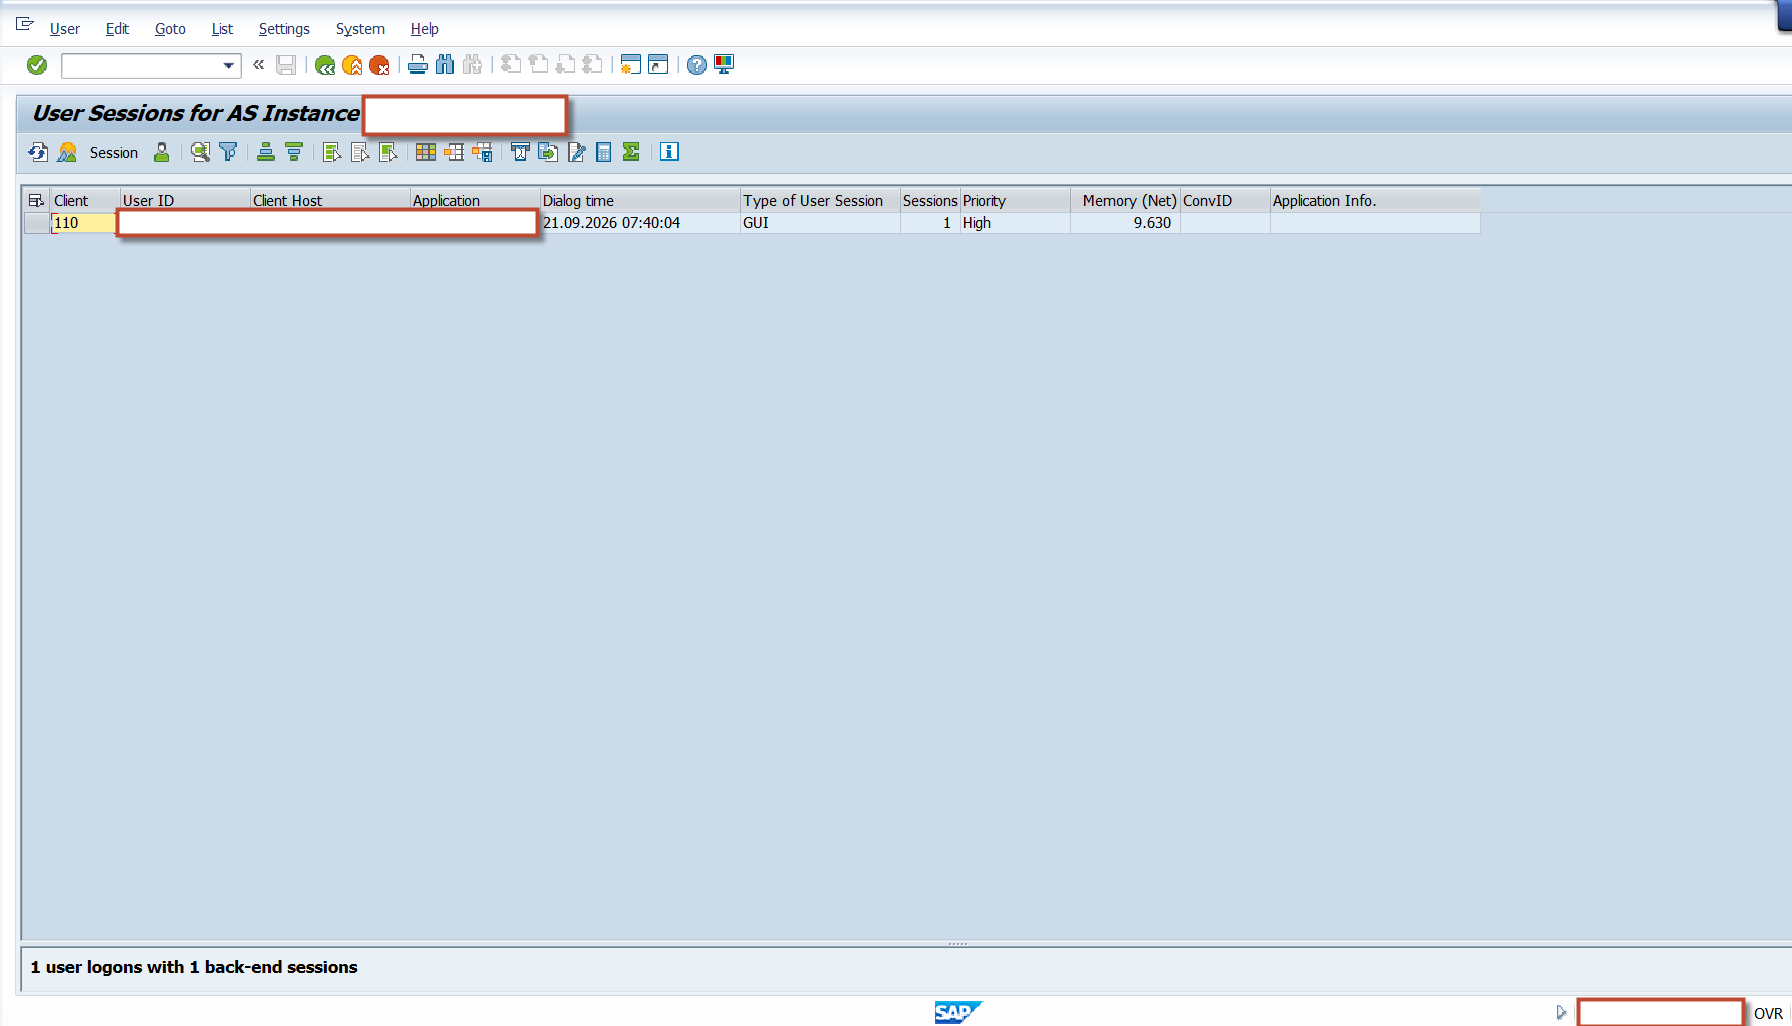
SM04 shows users on a selected application server, while AL08 provides a broader user overview. User counts alone do not prove load. Check whether sessions are active, idle, concentrated on one instance or running the same expensive transaction.
System Log and Short Dumps
SM21 records technical system events such as process, communication and database messages. ST22 explains ABAP runtime terminations with program, user, time, error analysis and source position. Correlate both with the incident timestamp and do not rely only on the most recent entry.
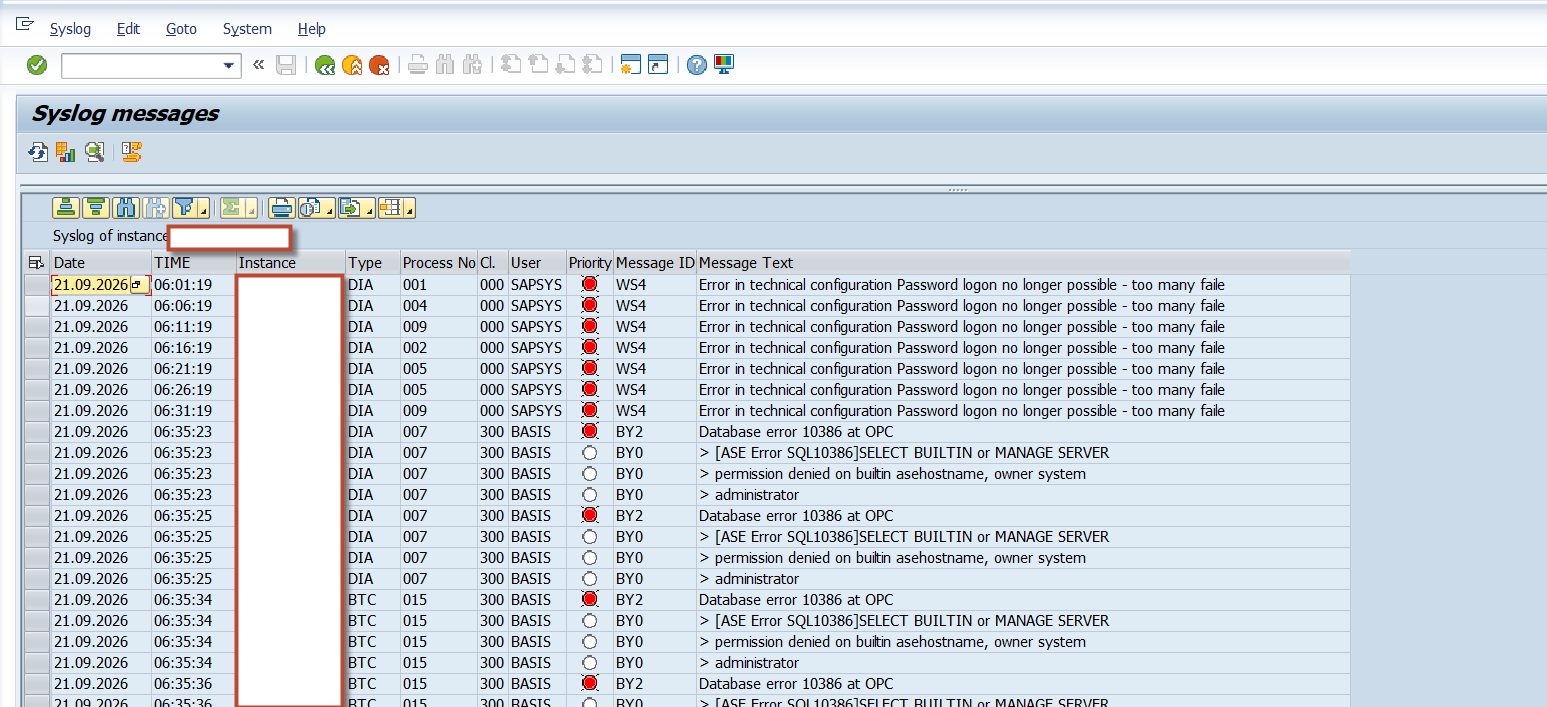
SM21
ST22
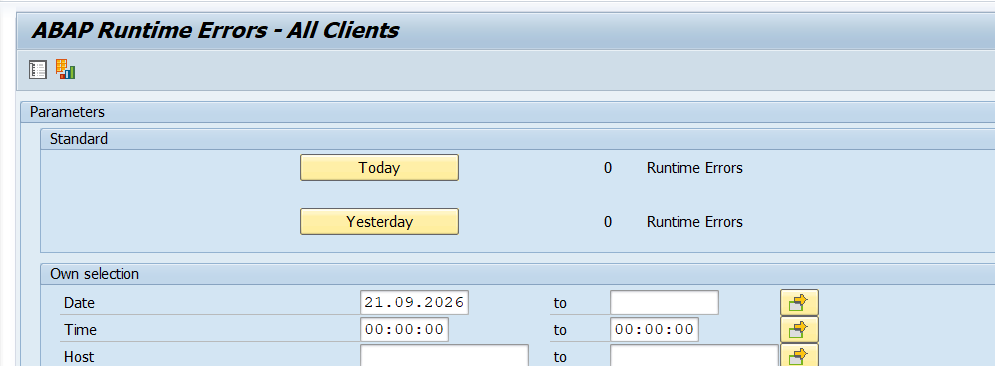
Screenshot 8.2 - ABAP Dump Analysis in ST22
Understand SAP Response Time
Dialog Step Timeline
A dialog response includes dispatcher wait, roll-in and roll-out, load and generation, ABAP processing, database time, enqueue time and communication. The total must be decomposed because each component points to a different owner and next tool.
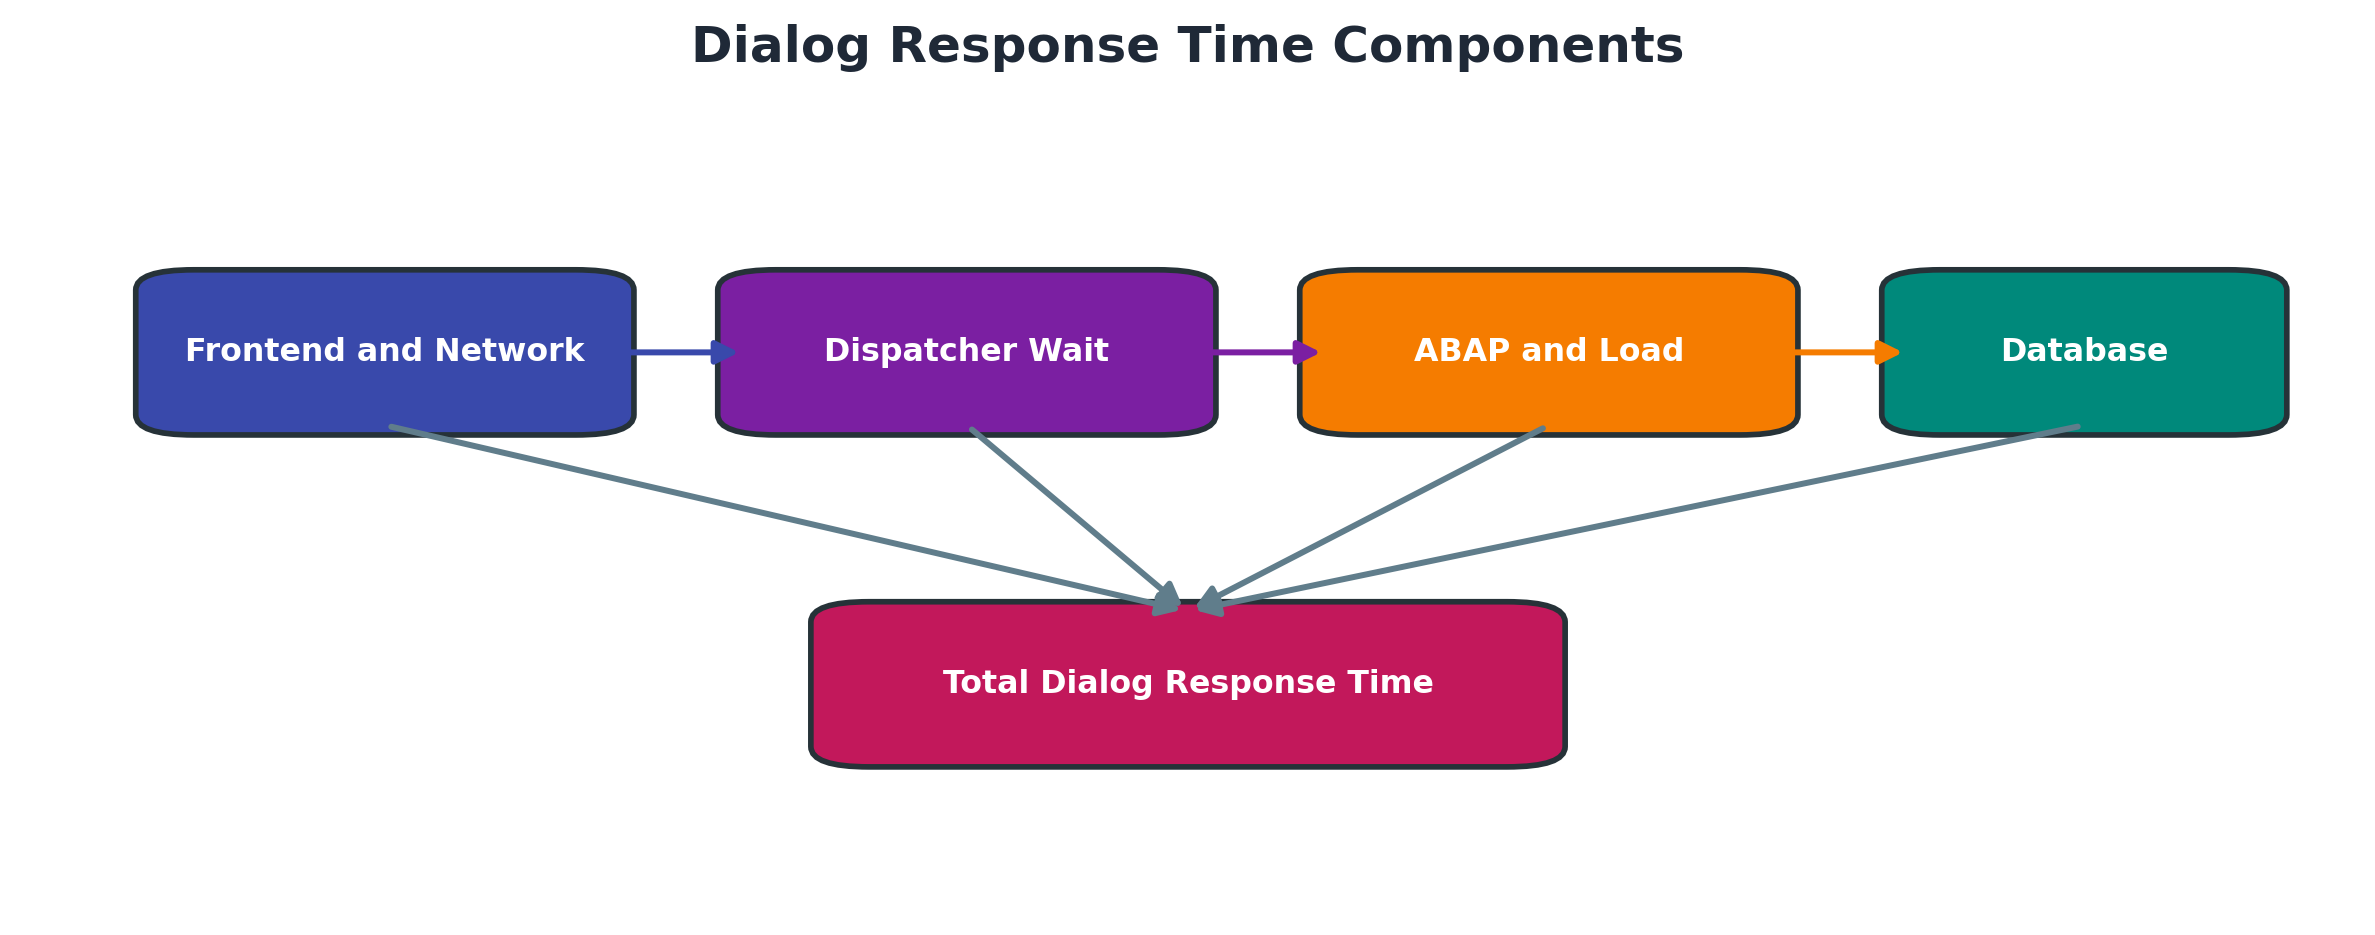
Figure 8.3 Dialog response time components
Workload Analysis with ST03N
ST03N aggregates workload by period, instance, task type, transaction, user and other dimensions. Begin with the exact date and interval, compare all instances, identify the affected task type and then rank transactions by total time, average response time and steps. High average time with very few steps may be less important than moderate time affecting thousands of steps.
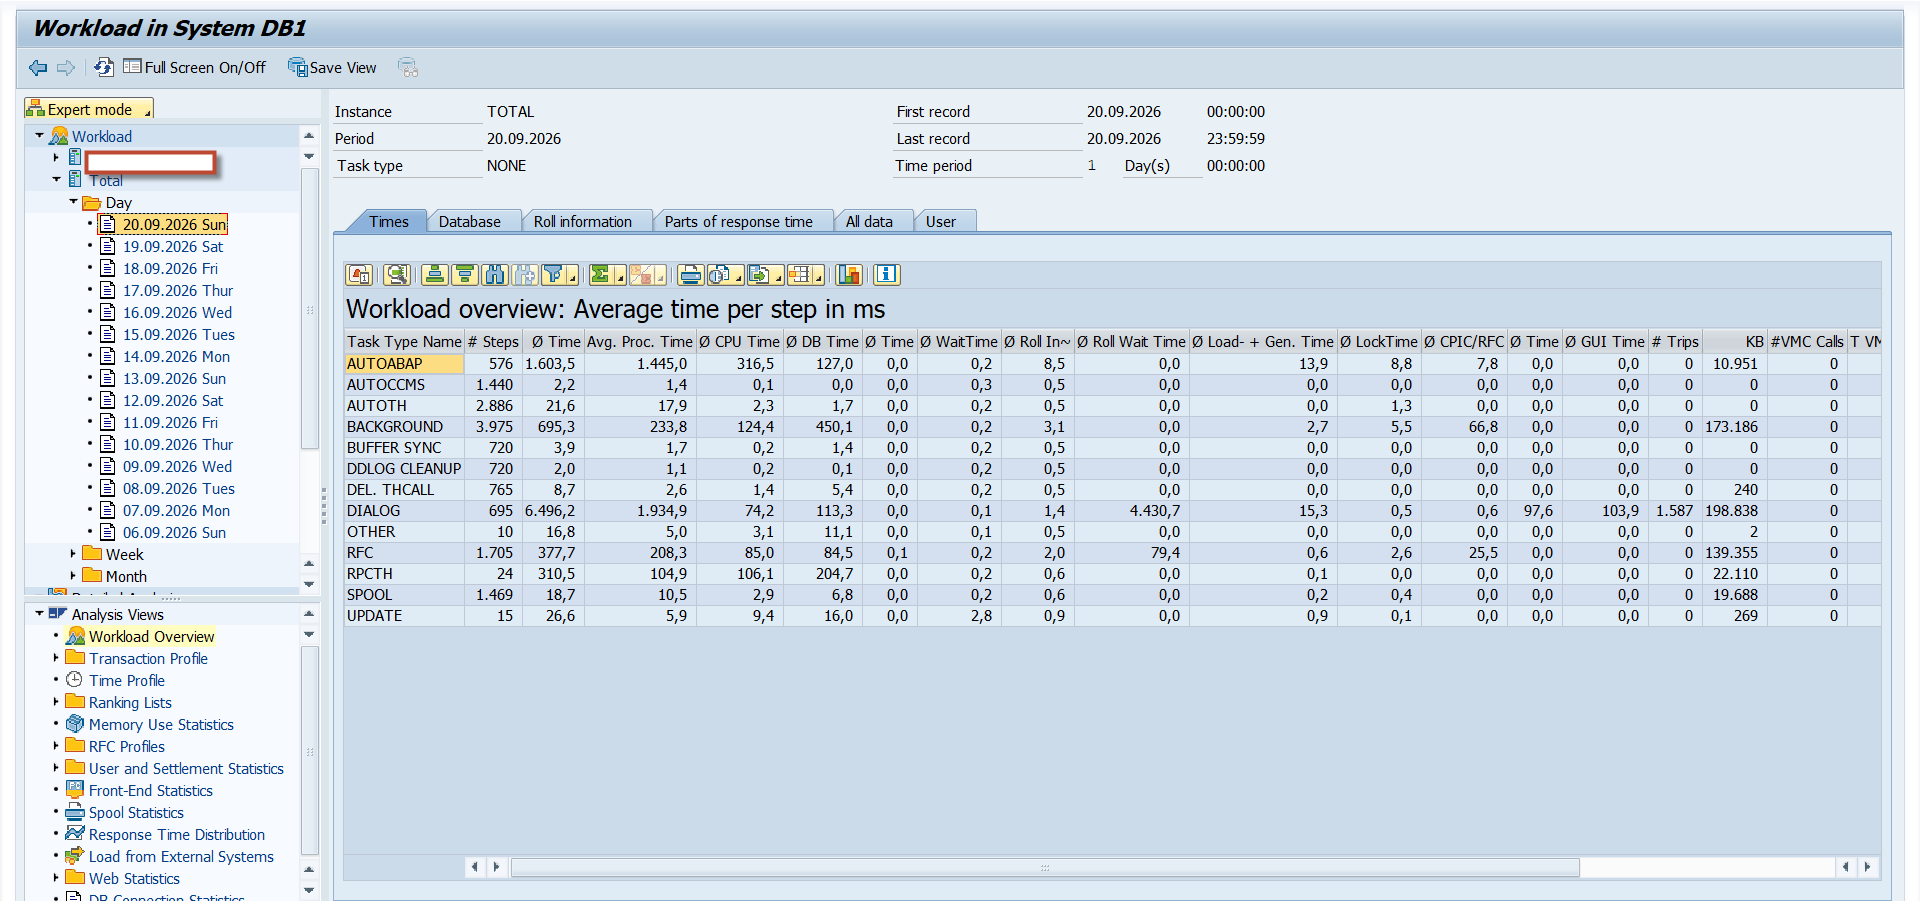
Screenshot 8.3 - Hourly Workload Analysis in ST03N
Single Statistical Records with STAD
STAD provides individual statistical records for a limited retention period. It is useful when the user, transaction and timestamp are known. Review response, CPU, database, wait, load, memory and RFC-related information for the exact slow step, then compare it with a normal record.
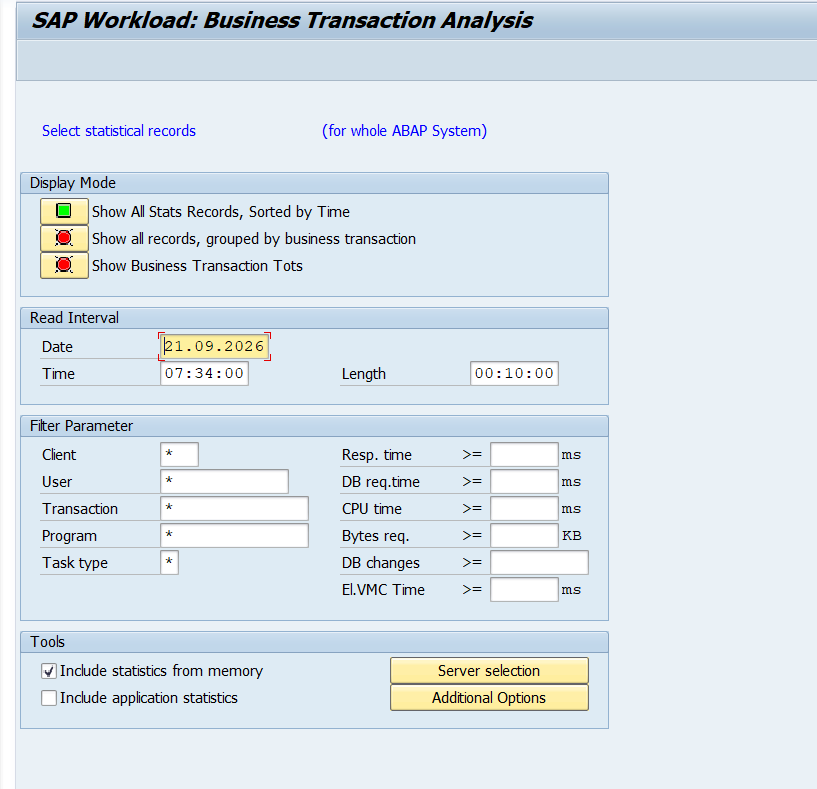
Screenshot 8.4 - Single Statistical Record in STAD
Separate Symptom from Bottleneck
Long response time is the symptom. High database time, dispatcher wait, CPU time, load time or enqueue time narrows the bottleneck. Confirm that the dominant component is abnormal for the same workload and time before proposing a change.
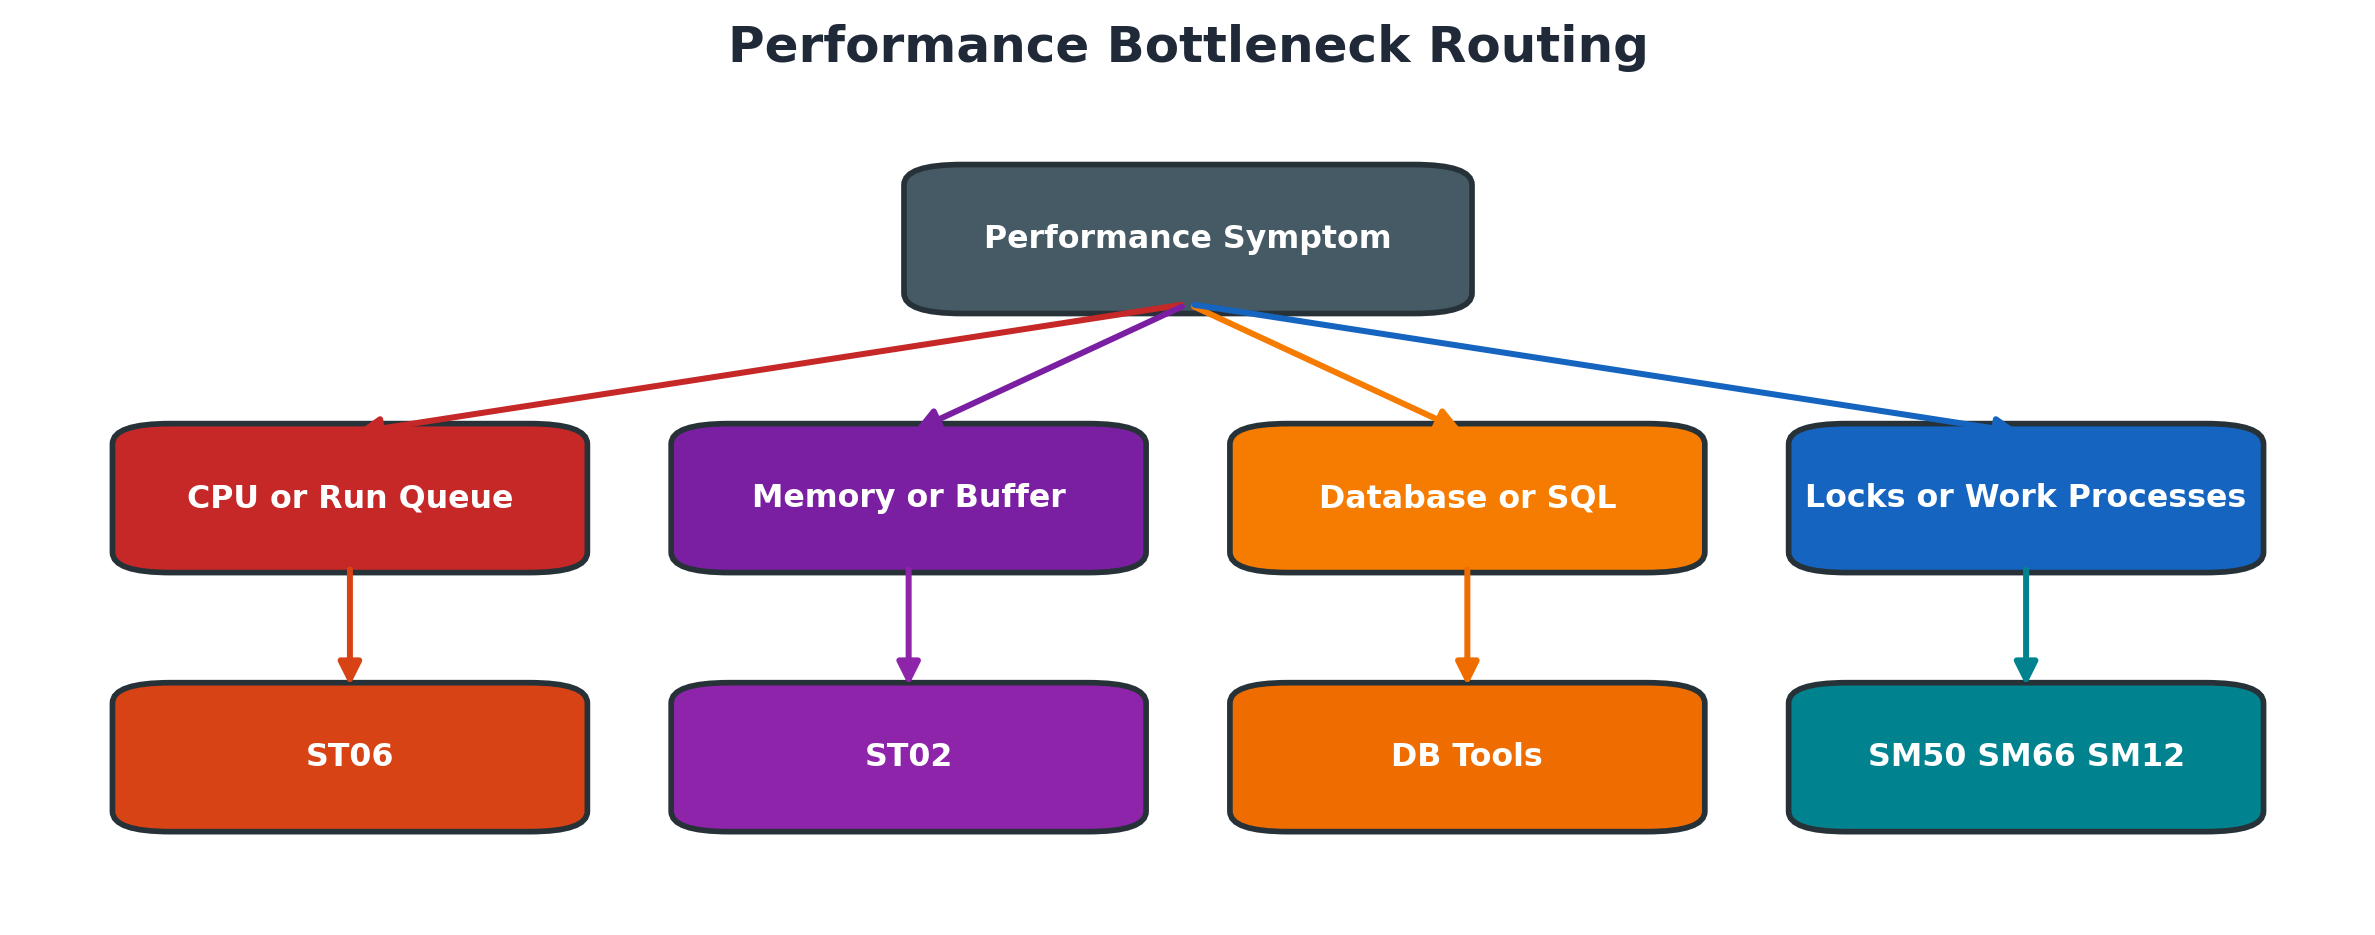
Figure 8.4 Performance bottleneck routing
Analyze Work Processes and Locks
Local Work Process Analysis with SM50
Use SM50 when one instance appears affected. Record process type, status, reason, action, program, user and elapsed time. Display details or a process trace only when required and authorized. Cancel a process only after confirming business impact, update risk and application-owner approval.
Analyze a process safely:
- Record incident time, instance and user impact.
- Refresh SM50 more than once to distinguish sustained activity from a snapshot.
- Filter or sort by elapsed time and status.
- Record process type, reason, action, program and user.
- Open process details only as needed.
- Correlate the process with STAD, ST03N, locks, updates or database activity.
- Obtain application approval before any cancellation.
- Validate business consistency after control action.
System Wide Analysis with SM66
Use SM66 when the problem may span instances or load distribution is uncertain. Filter long-running or active processes, compare servers and identify common programs or actions. If one server is saturated while others are idle, investigate logon groups, operation modes and instance health.
Lock Analysis with SM12
SM12 shows SAP logical locks. Review lock owner, client, table, argument and age. Contact the user or application owner and check related updates before deleting a lock. Removing a valid lock can allow conflicting business changes.
Update Analysis with SM13
SM13 shows update records and terminated updates. First correct the cause, such as database availability, application error or resource issue. Do not blindly repeat V1 updates. Object-specific guidance and business validation determine whether a failed update can be reprocessed safely.
Memory Buffers and Operating System
SAP Memory and Buffer Analysis with ST02
ST02 displays SAP memory areas and buffer quality, including usage, free space, swaps and hit ratios. A single swap count since startup is not enough to justify tuning. Check the time since startup, current pressure, repeated growth and affected buffer type, then correlate with load time and traces.
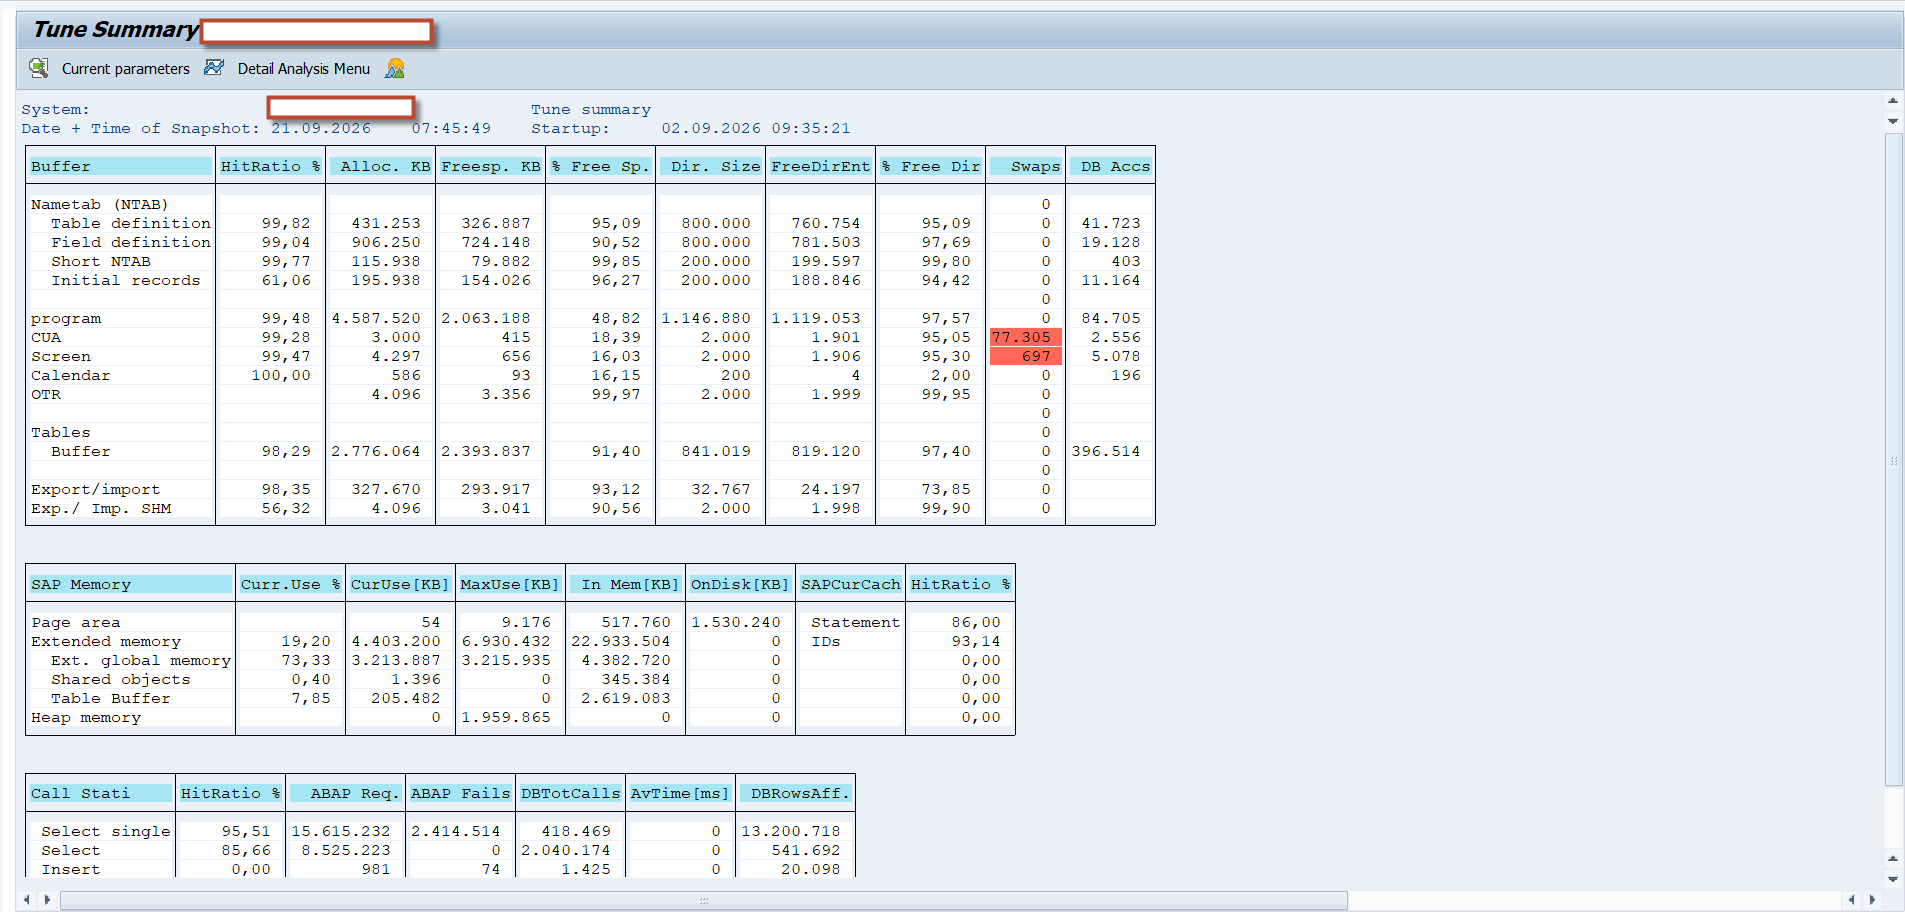
Screenshot 8.6 - SAP Memory and Buffer Analysis in ST02
Operating System Analysis with ST06
ST06 provides host CPU, memory, disk and operating-system statistics where configured. Review the incident interval, not only the current screen. Compare utilization with run queue, paging or swapping, disk response and
CPU Memory Disk and Network Correlation
CPU saturation, memory paging, slow storage and network loss can produce similar user complaints. Use host metrics and infrastructure monitoring to identify which resource is constrained. Confirm whether the condition affects one host, the database host or the full environment.
Developer Traces with ST11
ST11 displays developer traces from the instance work directory, such as dispatcher, work process, gateway and message-server traces. Use the file matching the affected component and timestamp. Trace files are technical and can rotate; preserve relevant evidence promptly and avoid raising trace levels without a defined duration.
Database and SQL Analysis
Database Health and Capacity
Confirm database availability, log or data-space capacity, backup health, blocked sessions and major alerts. Database-specific tools differ; use DBACOCKPIT or the approved native monitoring platform. Capacity emergencies must be stabilized before SQL tuning.
Correlate database evidence with SAP workload.
| Signal | Question | Next evidence |
| Space or log pressure | Is capacity blocking normal processing? | Database alerts and growth |
| Database time | Which workload and statements dominate? | ST03N STAD and SQL history |
| Waits or blocking | Which session or resource is blocking? | Lock and wait analysis |
| Plan change | Did execution behavior change recently? | Plan history statistics and changes |
| I/O latency | Is storage response abnormal for the interval? | Database and infrastructure metrics |
Expensive SQL and Wait Time
A high database-time component requires statement-level evidence. Identify expensive statements for the affected interval, execution count, elapsed time, records processed, plan and wait events. One long statement and a frequently executed moderate statement need different solutions.
Statistics Plans and Indexes
Outdated statistics, plan changes, missing or unsuitable indexes and large data growth can alter SQL performance. Do not create an index directly in production based only on one trace. Validate application ownership, SAP guidance, write overhead, transport method and regression risk.
Safe Escalation to Database Teams
Provide SID, database, host, exact start and end time, affected transaction or job, user impact, SAP response-time breakdown, SQL identifier when available, workload comparison and recent changes. This lets the database team investigate the same event instead of beginning from a vague slow-system report.
Alert Monitoring and Automation
CCMS Alert Monitor with RZ20
RZ20 organizes monitoring data into monitor sets and monitoring trees. Standard templates can show system, instance, operating-system, database, buffer, spool, background-processing and communication status. Use an alert as the entry point to analysis, not as automatic proof of a fault.
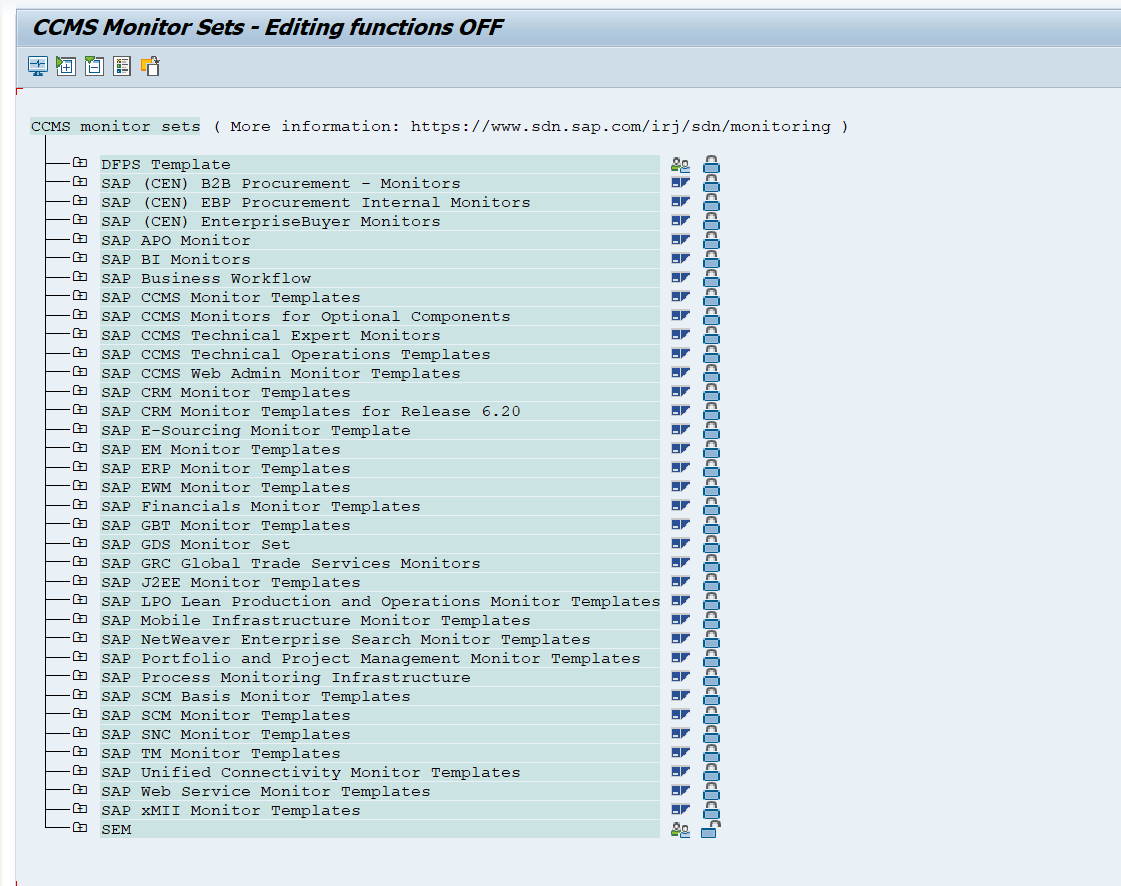
Screenshot 8.8 - CCMS Alert Monitor in RZ20
Monitoring Tree Elements and Thresholds
A monitoring tree contains contexts, objects and attributes. The attribute holds the value, threshold and alert history. Review current status, open alerts and properties. Change thresholds only with ownership, baseline evidence and a plan to prevent both noise and missed incidents.
Remote Monitoring and Analysis Methods
Central monitoring can register remote systems and use RFC connections to collect contexts. Analysis methods can open tools such as ST06 for the selected metric. Test RFC security, data collection and time synchronization so that central alerts match the managed system.
Alert Quality and Operational Response
Every actionable alert needs severity, owner, runbook, notification path and closure evidence. Remove duplicate noise, but do not suppress alerts before understanding them. Track missed incidents and false positives to improve the monitoring design.
Detailed Technical Reference
Statistical Records and Aggregation
SAP workload analysis combines aggregated and detailed evidence. ST03N summarizes workload by period, instance, task type, transaction, user, report and other dimensions. STAD exposes individual statistical records for a limited retention period. Aggregation is ideal for identifying when and where performance changed; the single record is required to understand one slow step. Never compare an hourly average with one worst-case record without labeling the difference.
A record can contain response time, wait time, processing time, database time, load and generation time, roll time, enqueue time, RFC or GUI/network-related measures depending on release and task type. The sum and labels vary by kernel/release. Always use the field documentation in the installed system and preserve the selected period, instance, task type and record identity.
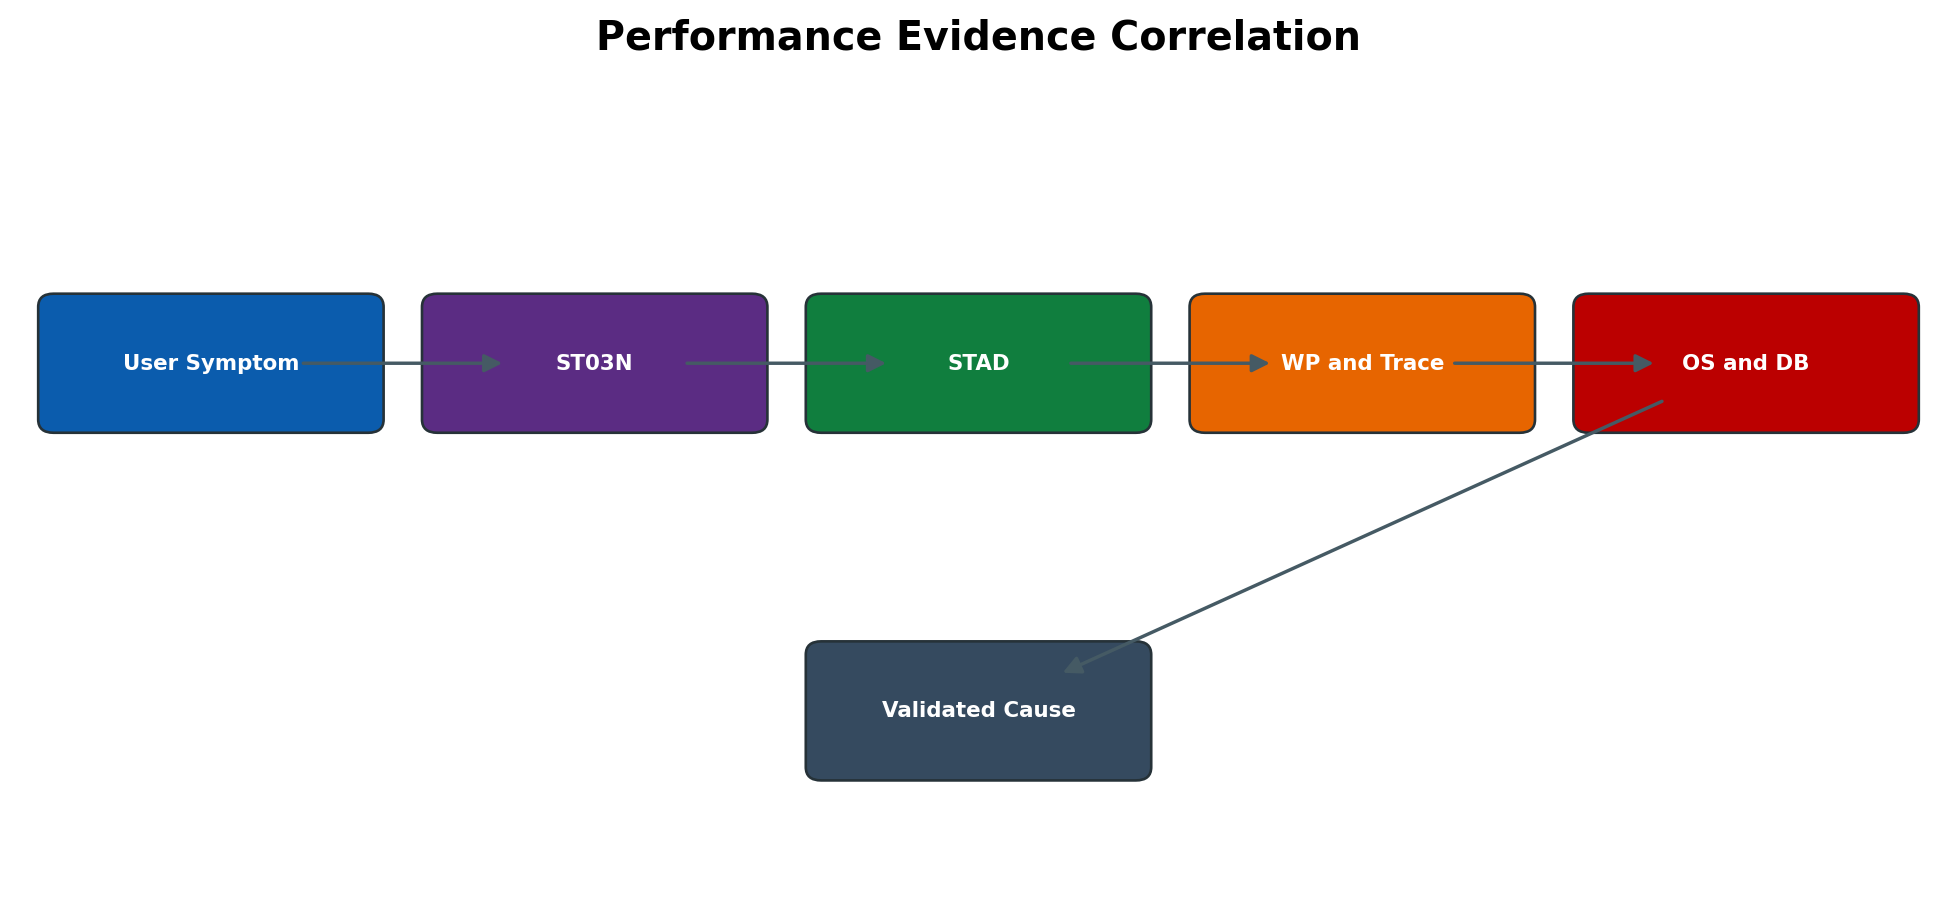
Figure 8.6 Performance evidence correlation
Response Time Components and Interpretation
Total response time is an outcome, not a diagnosis. High wait time usually indicates that a request waited for a free dialog work process. High processing/CPU time points toward ABAP processing or CPU contention. High database time requires SQL and database-wait analysis. High load/generation time may occur after transport, invalidation or cold buffers. Enqueue, RFC, frontend/network and roll components require their corresponding layer to be investigated.
Ratios are context-sensitive. Batch, RFC, update and dialog workloads have different expectations. An average can hide a small group of extremely slow steps, while one outlier does not prove system-wide degradation. Compare the incident window to the same workload in a known-good period and include throughput: lower response with dramatically lower volume may not be an improvement.
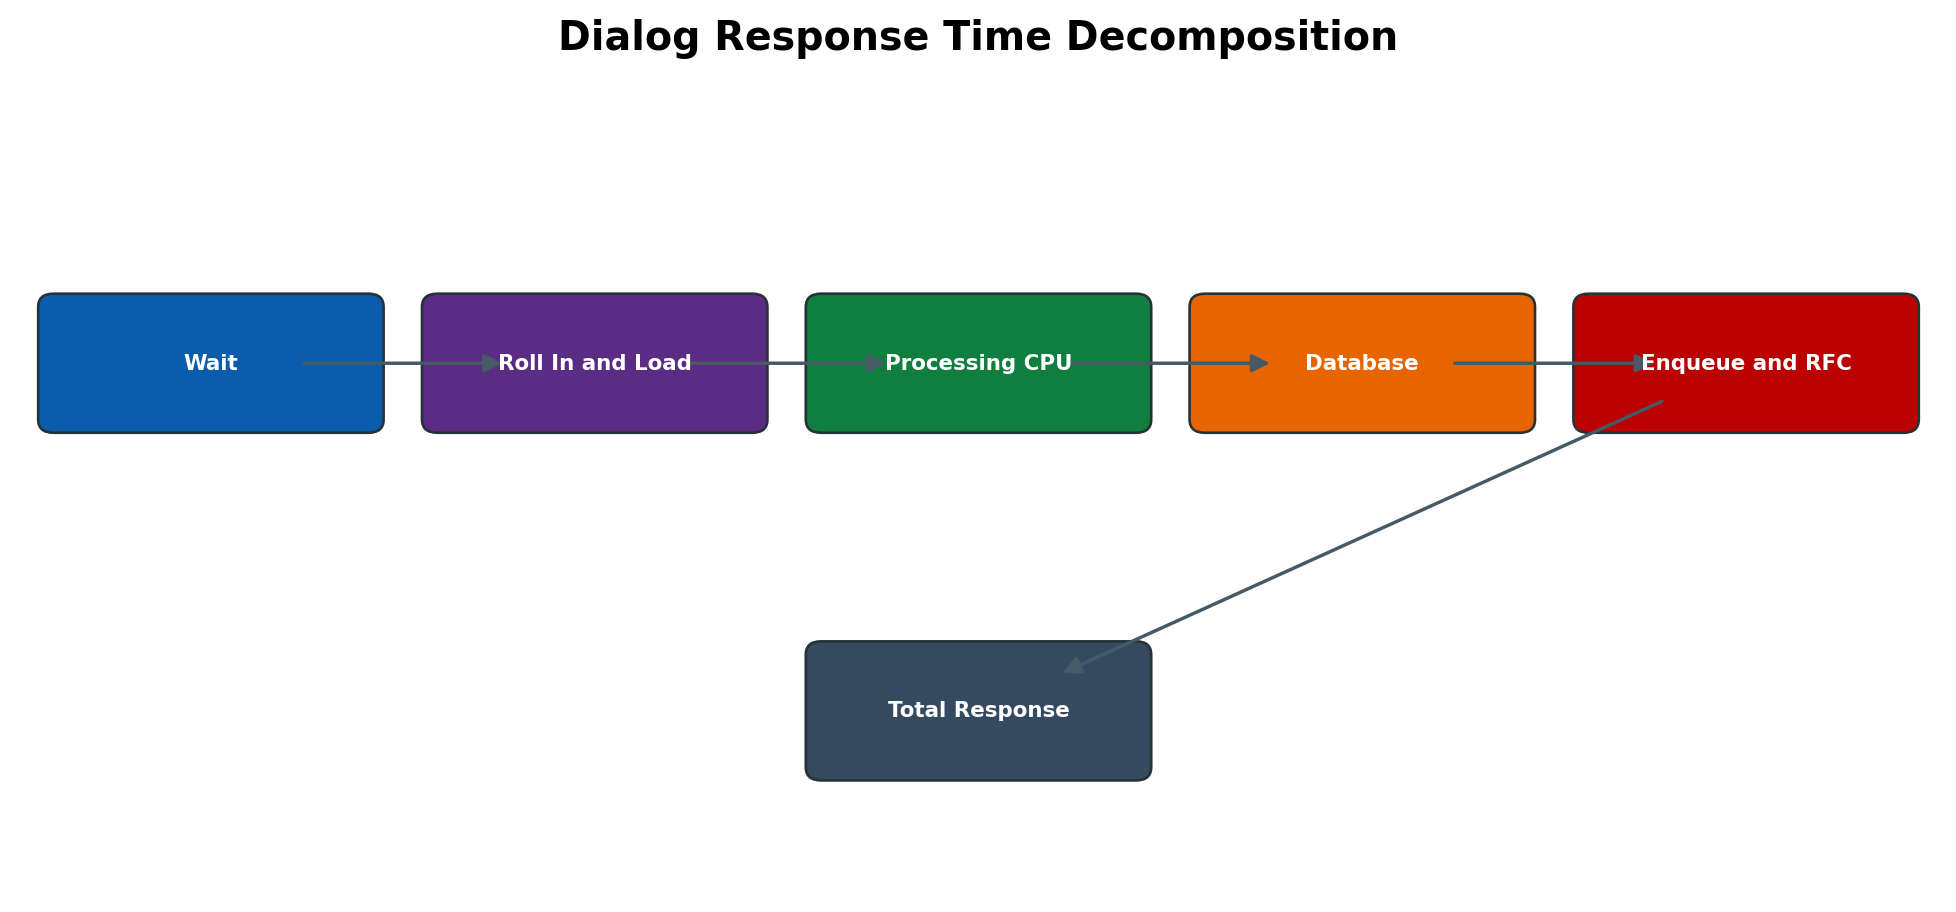
Figure 8.7 Dialog response time decomposition
Work Process Actions and Wait Reasons
SM50 shows local instance work processes; SM66 provides system-wide visibility. Important evidence includes instance, work-process number/type, status, action, client, user, program, table and elapsed time. A Running status can represent productive work, SQL execution, RFC communication or a loop. Waiting is not automatically abnormal: idle processes wait by design. Diagnose the action and duration in context.
Before canceling, determine whether the request is committing business data, holding locks, executing an update, running a background package or waiting on a recoverable dependency. Capture a process snapshot and correlated SM12, SM13, database and trace evidence. Repeated cancellation can create update inconsistencies, duplicate retries or lost diagnostic evidence.
SAP Memory Hierarchy and Buffer Quality
ST02 summarizes buffers and memory-related counters. Buffer quality must be interpreted through swaps, directory entries, free space, displacement history and workload changes—not a single percentage. Program, table, nametab and other buffers serve different objects. A buffer can show good hit ratio while still experiencing bursts of swaps after transports or restarts.
ABAP memory consumption can move through extended memory and, depending on platform and configuration, heap/private memory. Host physical memory and swap/paging determine whether configuration is sustainable. Increasing a SAP memory parameter without checking all instances and host allocation can cause startup failure or operating-system paging. RZ11 documents current/default values and dynamic behavior; approved persistent changes belong in profile management and require rollback.
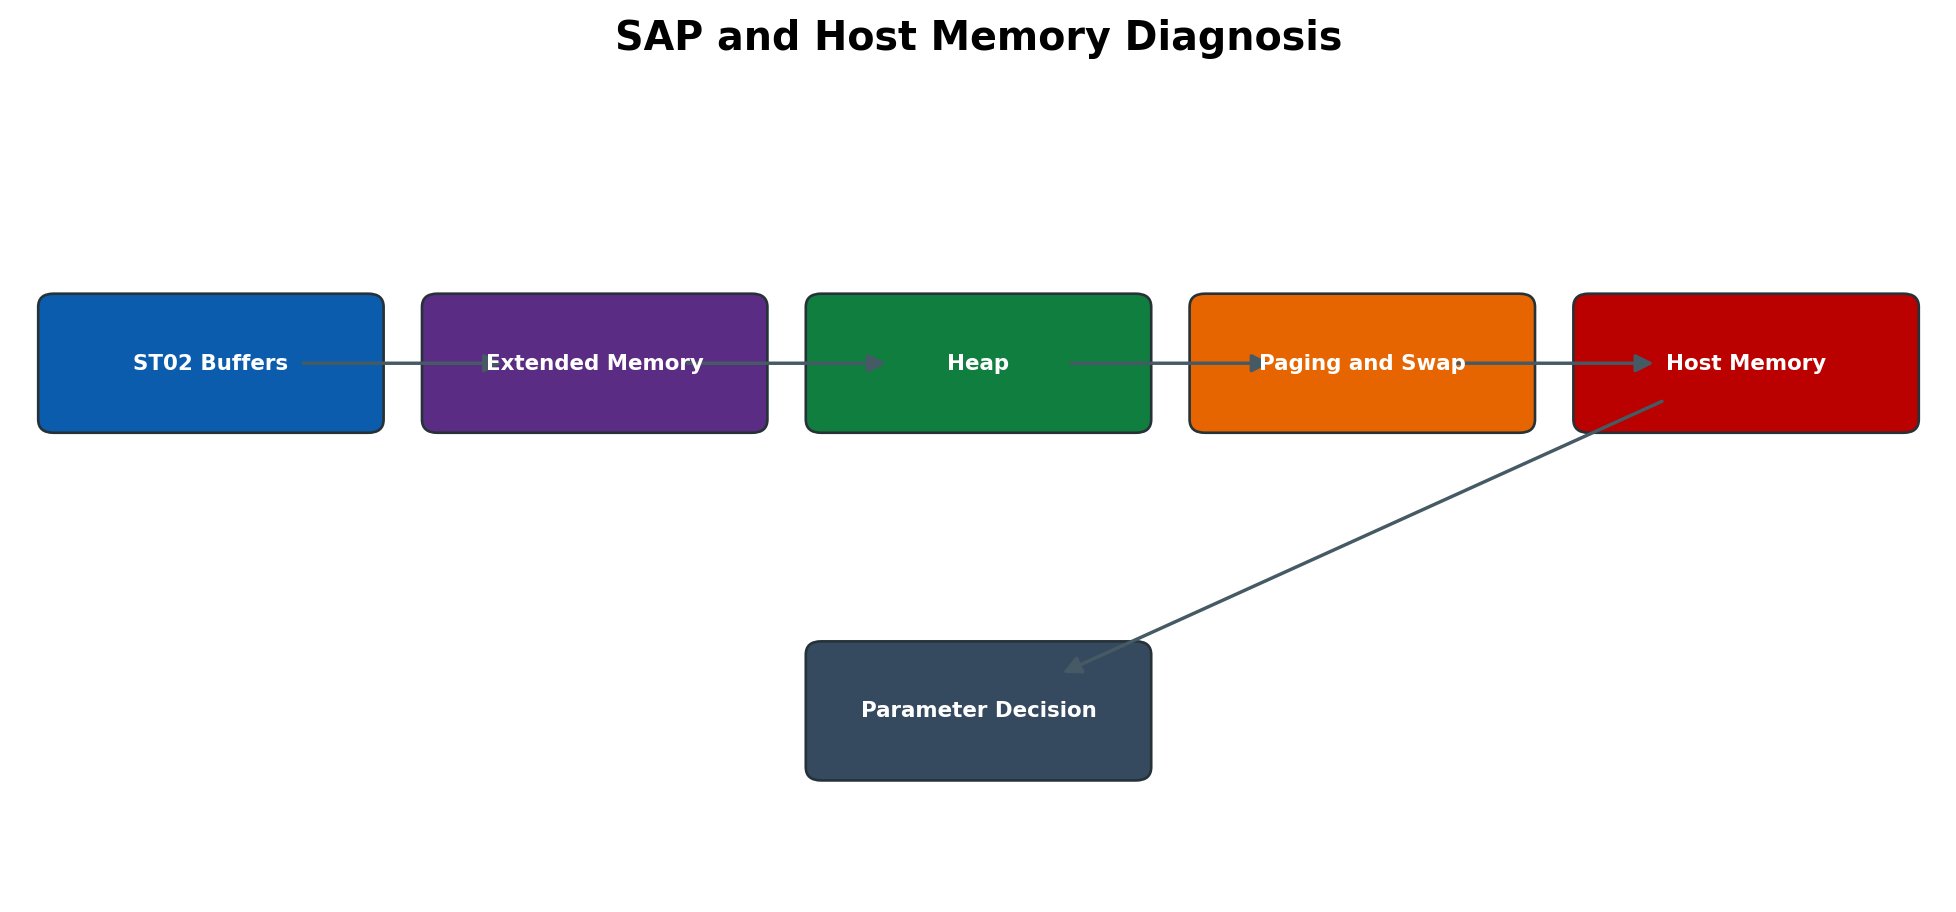
Figure 8.8 SAP and host memory diagnosis
Operating System Saturation and Virtualization
ST06 and host tools expose CPU utilization, run queue, physical memory, paging, disk activity and network indicators. High CPU is meaningful only with duration, number of busy cores, run queue and top consumers. High memory utilization may be normal cache use; sustained paging and major faults are stronger pressure indicators. Disk utilization without latency and queue depth can be misleading.
In virtual or cloud infrastructure, guest metrics may not reveal CPU ready/steal time, storage throttling, noisy-neighbor contention or host limits. Correlate SAP timestamps with hypervisor/cloud monitoring. Time synchronization is essential: a five-minute clock difference can make unrelated OS and SAP events appear causal.
Database Time SQL and Wait Analysis
High database time in ST03N/STAD is the entry point, not proof of a database defect. Identify the exact program/transaction and SQL using DBACOCKPIT or the database-specific performance tools available for the installed platform. Evaluate execution count, total time, time per execution, records processed, access path, blocking and resource waits. One expensive statement called once differs from a moderately expensive statement called millions of times.
Statistics or index changes require DBA/application ownership, test evidence and rollback. An index that helps one statement can slow writes and consume memory/storage. Parameter changes can move waits rather than remove them. Reproduce with representative bind values, validate plan and workload after correction, and check business result—not only query duration.
Trace Files Collection and Overhead
ST11 provides controlled access to developer traces such as dispatcher, work-process, gateway and message-server traces. Trace file names and components vary. Always capture host, instance, process, file, timestamp and relevant lines around the first error. Do not upload complete traces without reviewing credentials, user data, hostnames and business values.
Increasing trace level or activating ST01/STAUTHTRACE, SQL trace or RFC trace can add overhead and produce sensitive high-volume data. Define user/component, shortest time window, file-size monitoring and stop condition before activation. Reproduce once, deactivate immediately, collect results and restore the original level.
Monitoring Retention Time Synchronization and Baselines
STAD detail, dumps, system logs, traces, job logs and CCMS alerts have different retention. Evidence may disappear while an incident is still being discussed. Record the system time zone, user-local time, application-server clock and monitoring-platform time. Preserve incident evidence according to security and privacy requirements.
A baseline must include workload volume and business calendar: dialog steps, background jobs, interfaces, users, CPU, database load and response components for comparable periods. Month end and Monday morning are not equivalent to a quiet weekend. Thresholds should detect sustained abnormal behavior and include owner, severity, response and suppression rules.
Expanded Performance Procedures
Create a Performance Baseline
- 1. Choose a representative business period and comparable quiet period. Record system/client scope, time zone, business workload and known batch/interface activity.
- 2. ST03N → Expert Mode → select system/instance and Day/Hour → capture dialog, background, RFC and update steps, throughput and response components.
- 3. ST06 → capture CPU, run queue, physical memory, paging, disk and network history for the same timestamps.
- 4. ST02 → capture buffer swaps/free space and memory counters per instance. Check database workload/capacity and critical queues.
- 5. Calculate normal ranges by hour/day and identify expected peak windows. Do not turn a one-day observation into a threshold.
- 6. Document owner, alert threshold, duration, severity and validation method. Revisit after upgrades, sizing, major transport or workload change.
Analyze One Slow Dialog Step
- 1. Record user, client, transaction/app, exact action, document scope, start/end timestamp and whether retry changes result.
- 2. ST03N → select incident hour → Transaction/Profile view. Confirm whether the transaction and system averages are abnormal.
- 3. STAD → filter exact window/user/transaction/server → open the slow record. Identify dominant response component and program.
- 4. If wait dominates, check SM50/SM66 capacity. If database dominates, capture SQL/DB evidence. If enqueue/RFC dominates, inspect that dependency. If processing dominates, capture safe ABAP/process evidence.
- 5. Correlate ST22, SM21, ST11, locks, updates and application logs. Correct the first confirmed cause through change control.
- 6. Repeat the same business action with comparable data; compare record components, business result and system-wide side effects.
Diagnose Work Process Saturation
- 1. ST03N → confirm increased wait time and throughput in the incident window. Determine affected task type and instances.
- 2. SM50 on each relevant instance and SM66 system-wide → capture process types, status, action, elapsed time, program and queue evidence.
- 3. Identify long-running, PRIV, stopped or dependency-waiting processes. Correlate with SM12, SM13, DB waits, RFC destinations and background jobs.
- 4. Determine whether saturation is capacity, runaway work, wrong operation mode, unbalanced logon group or downstream delay.
- 5. Correct the cause or reschedule workload. Change process counts/operation modes only after memory/CPU impact and restart/dynamic behavior are known.
- 6. Validate reduced wait time, stable queues and unchanged business completion. Monitor the next peak period.
Diagnose Memory Pressure
- 1. Capture ST02 per instance, ST06 host memory/paging, SM50 process states and time-aligned dumps/system log.
- 2. Identify buffer swaps or exhaustion, extended-memory pressure, heap/PRIV growth and the specific programs/users consuming memory.
- 3. Check effective parameters in RZ11, instance profile source, host physical memory and all co-located instances.
- 4. Correct program selection/package size or workload concurrency before enlarging memory. For parameter changes, calculate total allocation and define rollback/startup access.
- 5. Implement in lower environment or controlled change window. Restart only if required and validate every instance.
- 6. Compare ST02, paging, PRIV processes, dumps, response time and business throughput across the next peak.
Investigate Short Dumps and System Log Together
- 1. ST22 → select exact date/time → open representative dump. Record runtime error, user, program, server, termination point and error analysis.
- 2. SM21 → same timestamp and server → inspect system, memory, communication, database and process events.
- 3. ST11 → open the relevant work-process/dispatcher/gateway trace around the first failure, not only repeated secondary messages.
- 4. Correlate job/RFC/update/lock/application evidence and determine whether the dump is cause, symptom or consequence.
- 5. Correct the confirmed program/configuration/infrastructure cause; preserve sensitive evidence and restore trace levels.
- 6. Reproduce safely or monitor the next execution. Confirm no new dump/system-log error and validate the business result.
Validate a Performance Change
- 1. Before change, preserve baseline, incident data, configuration and rollback values. Define success using response components, throughput, resource use and business outcome.
- 2. Apply one controlled change where possible. Record exact parameter/code/index/job/schedule version and activation/restart time.
- 3. Repeat the same workload or wait for a comparable peak. Use ST03N/STAD plus OS/database metrics for the same interval.
- 4. Check regression: other transactions, background jobs, updates, memory, CPU, database writes and interfaces.
- 5. If target is not met or regression appears, execute rollback and validate recovery.
- 6. Retain before/after evidence and update monitoring threshold or runbook only after repeated stable results.
| Symptom or metric | First evidence | Likely layer | Next validation |
| High wait time | ST03N then SM50/SM66 | Dialog/background capacity, long work, logon distribution | Queue/process snapshot and operation mode/capacity. |
| High processing time | STAD program and SM50 action | ABAP processing, CPU, large selection | ST06 CPU and safe code/runtime analysis. |
| High database time | STAD plus DB performance tool | SQL, blocking, I/O, plan/statistics | Execution count, per-call time, waits and bind values. |
| High load/generation | ST03N/STAD and recent changes | Cold buffers, generation after transport/restart | ST02 swaps, generation activity and repeat behavior. |
| High enqueue time | STAD plus SM12 | Application lock contention | Lock owner, argument, active session/update and business flow. |
| High RFC time | STAD plus destination/interface logs | Remote system/network/downstream processing | SM59 layer test and remote workload timestamps. |
| PRIV or heap growth | SM50 plus ST02/ST06 | Extended memory pressure or program allocation | Program scope, EM/heap parameters, host paging. |
| Frequent dumps | ST22 plus SM21/ST11 | Program, memory, DB, kernel or communication | First dump at incident start and correlated trace. |
Practical Performance Investigation
Prepare Evidence
Before opening tools, capture the user statement in measurable form: affected system, client, transaction, user group, timestamp, duration, frequency, expected runtime, actual runtime and whether all users or one path are affected. Check recent transports, restarts, batch changes and infrastructure events.
Create an incident evidence record:
- Record SID, client and environment.
- Record start and end time with timezone.
- Identify affected users, transactions, jobs and interfaces.
- State expected and actual runtime or response.
- Determine whether scope is one user, one transaction, one instance or the whole system.
- Record recent transports, restarts, batch or infrastructure changes.
- Preserve error text and correlation identifiers.
- Choose the first tools based on scope, not habit.
Investigate System Wide Slowness
For a system-wide complaint, check availability and recent restarts, SM66 saturation, ST03N workload by instance and task type, ST06 host pressure, database health, locks, updates, dumps and system log. Use the same time window in every tool.
Use this system-wide sequence:
- Confirm services and application servers are available.
- Check time synchronization and the incident window.
- Review SM66 repeatedly for saturation and common actions.
- Use ST03N to compare workload, instances and time profiles.
- Review ST06 for CPU, memory, paging and I/O pressure.
- Check database capacity, waits and expensive SQL.
- Review SM12, SM13, ST22 and SM21 for correlated exceptions.
- Form one evidence-backed hypothesis and test it safely.
Investigate One Slow Transaction
For one transaction, identify representative slow and normal executions. Use ST03N to establish volume and trend, STAD for specific steps, then follow the dominant component toward SQL, locks, RFC, load or ABAP analysis. Preserve input scale because a larger selection can legitimately take longer.
Use this transaction-focused sequence:
- Obtain exact input, user and timestamps.
- Compare slow and normal executions with similar data volume.
- Use ST03N for trend, steps and total business impact.
- Use STAD for response-time components of specific records.
- Follow dominant time to ABAP, SQL, RFC, lock, load or network analysis.
- Check recent transports and data growth.
- Apply the approved correction in a testable scope.
- Repeat the same business case and compare results.
Validate Improvement and Close
Repeat the same workload under comparable conditions. Compare response-time components, throughput, errors and resource use with the baseline. Confirm with the business user, monitor for recurrence and document the cause, correction, risk and preventive control.
Security Audit and Production Controls
Monitoring Authorizations
Grant display and analysis access according to role. Powerful transactions can reveal business data, users, programs or host details, and control functions can interrupt processing. Separate routine monitoring from emergency administration.
Sensitive Diagnostic Data
Screenshots, traces, dumps and statistical records may contain user IDs, document numbers, SQL text, hostnames, paths or personal information. Mask publication copies and store incident evidence only in approved locations.
Trace and Performance Overhead
ST01, SQL traces and elevated developer-trace levels can generate large volumes and affect performance. Define target user or process, start time, stop time, storage capacity and owner. Stop the trace immediately after reproduction and protect the output.
Change Control and Evidence Retention
Parameter, threshold, index, operation-mode and infrastructure changes require approved ownership and rollback. Retain before-and-after metrics, timestamps and validation long enough to support problem management and audit requirements.
Common Errors and Solutions
Work Process and Runtime Errors
Use timestamp, scope and repeated observations before controlling a process.
Do not control a process until ownership and business impact are clear.
| Error or symptom | Likely cause | Diagnostic action and solution | Validation |
| All dialog work processes busy | Long-running programs lock waits external calls or insufficient capacity | Capture repeated SM50 and SM66 views, identify common action and correlate with ST03N or STAD. Correct the owning workload; cancel only with approval. | Queue falls and dialog steps complete normally. |
| Work process in PRIV mode | User context exceeded extended-memory allocation | Identify user and program, review memory consumption and selection size, then correct application or approved memory design. | PRIV recurrence stops without unsafe memory growth. |
| High dispatcher wait time | Work-process saturation or uneven instance distribution | Compare wait component, queues, SM66 and workload per instance; correct scheduling or load distribution. | Wait time returns toward baseline. |
| Old lock blocks users | Active session terminated update or abandoned transaction | Check SM12 owner, session and SM13; contact owner and remove only when proven orphaned. | Business transaction proceeds without conflicting updates. |
| Repeated short dumps | Application defect memory limit conversion or resource failure | Use ST22 error ID, program, timestamp and source position; correlate SM21 and recent changes. | Reproduction completes and no new matching dumps occur. |
Memory Operating System and Database Errors
Correlate SAP time components with host and database evidence.
Use correlated evidence instead of isolated red values.
| Error or symptom | Likely cause | Diagnostic action and solution | Validation |
| Buffer swaps keep increasing | Undersized buffer abnormal load or invalidation pattern | Review ST02 since startup, free space, hit ratio and load time; compare with healthy period before tuning. | Swap growth and load time stabilize. |
| CPU high with slow users | Expensive ABAP SQL or excessive concurrency | Use ST06 interval and run queue, then correlate ST03N CPU and active processes. Reduce or tune confirmed workload. | CPU queue and response time improve together. |
| Paging or swap activity | Host memory pressure or competing processes | Confirm OS paging, resident memory and SAP memory use; involve infrastructure team and correct capacity or allocation. | Paging stops during comparable load. |
| Database time dominates | Expensive SQL contention I/O or database resource issue | Identify statements and waits for exact interval; validate plans, statistics, locks and capacity with DB team. | DB time and statement runtime improve. |
| Filesystem nearly full | Trace log spool archive or database growth | Identify owner and growth source, protect required evidence, perform supported cleanup and add monitoring. | Free space remains above approved threshold. |
Monitoring Tool and Alert Errors
Validate data collection and threshold design before trusting or suppressing an alert.
The monitoring path itself can fail or mislead.
| Error or symptom | Likely cause | Diagnostic action and solution | Validation |
| RZ20 shows stale values | Collector RFC agent or data-supply issue | Check last collection time, managed-system availability and monitoring infrastructure before acting on value. | Fresh values and timestamps appear. |
| Too many false alerts | Thresholds ignore workload pattern or duplicate monitors | Analyze alert history and baseline, tune approved thresholds and remove duplicate notification routes. | Actionable signal improves without missed events. |
| STAD record not available | Retention expired wrong instance or wrong time conversion | Confirm timezone and exact timestamp, search relevant instance and use ST03N aggregates or external evidence. | Required event is found or limitation is documented. |
| ST06 lacks expected data | OS collector or authorization problem | Check collector status, host registration and display authorization; use approved infrastructure monitor meanwhile. | Current host metrics are available. |
| Trace file grows rapidly | Broad or elevated trace left active | Stop trace, preserve required segment, check filesystem and document the controlled trace window. | Trace level is normal and capacity stable. |
Diagnostic Decision Process
Route the investigation from affected scope and dominant response-time component.
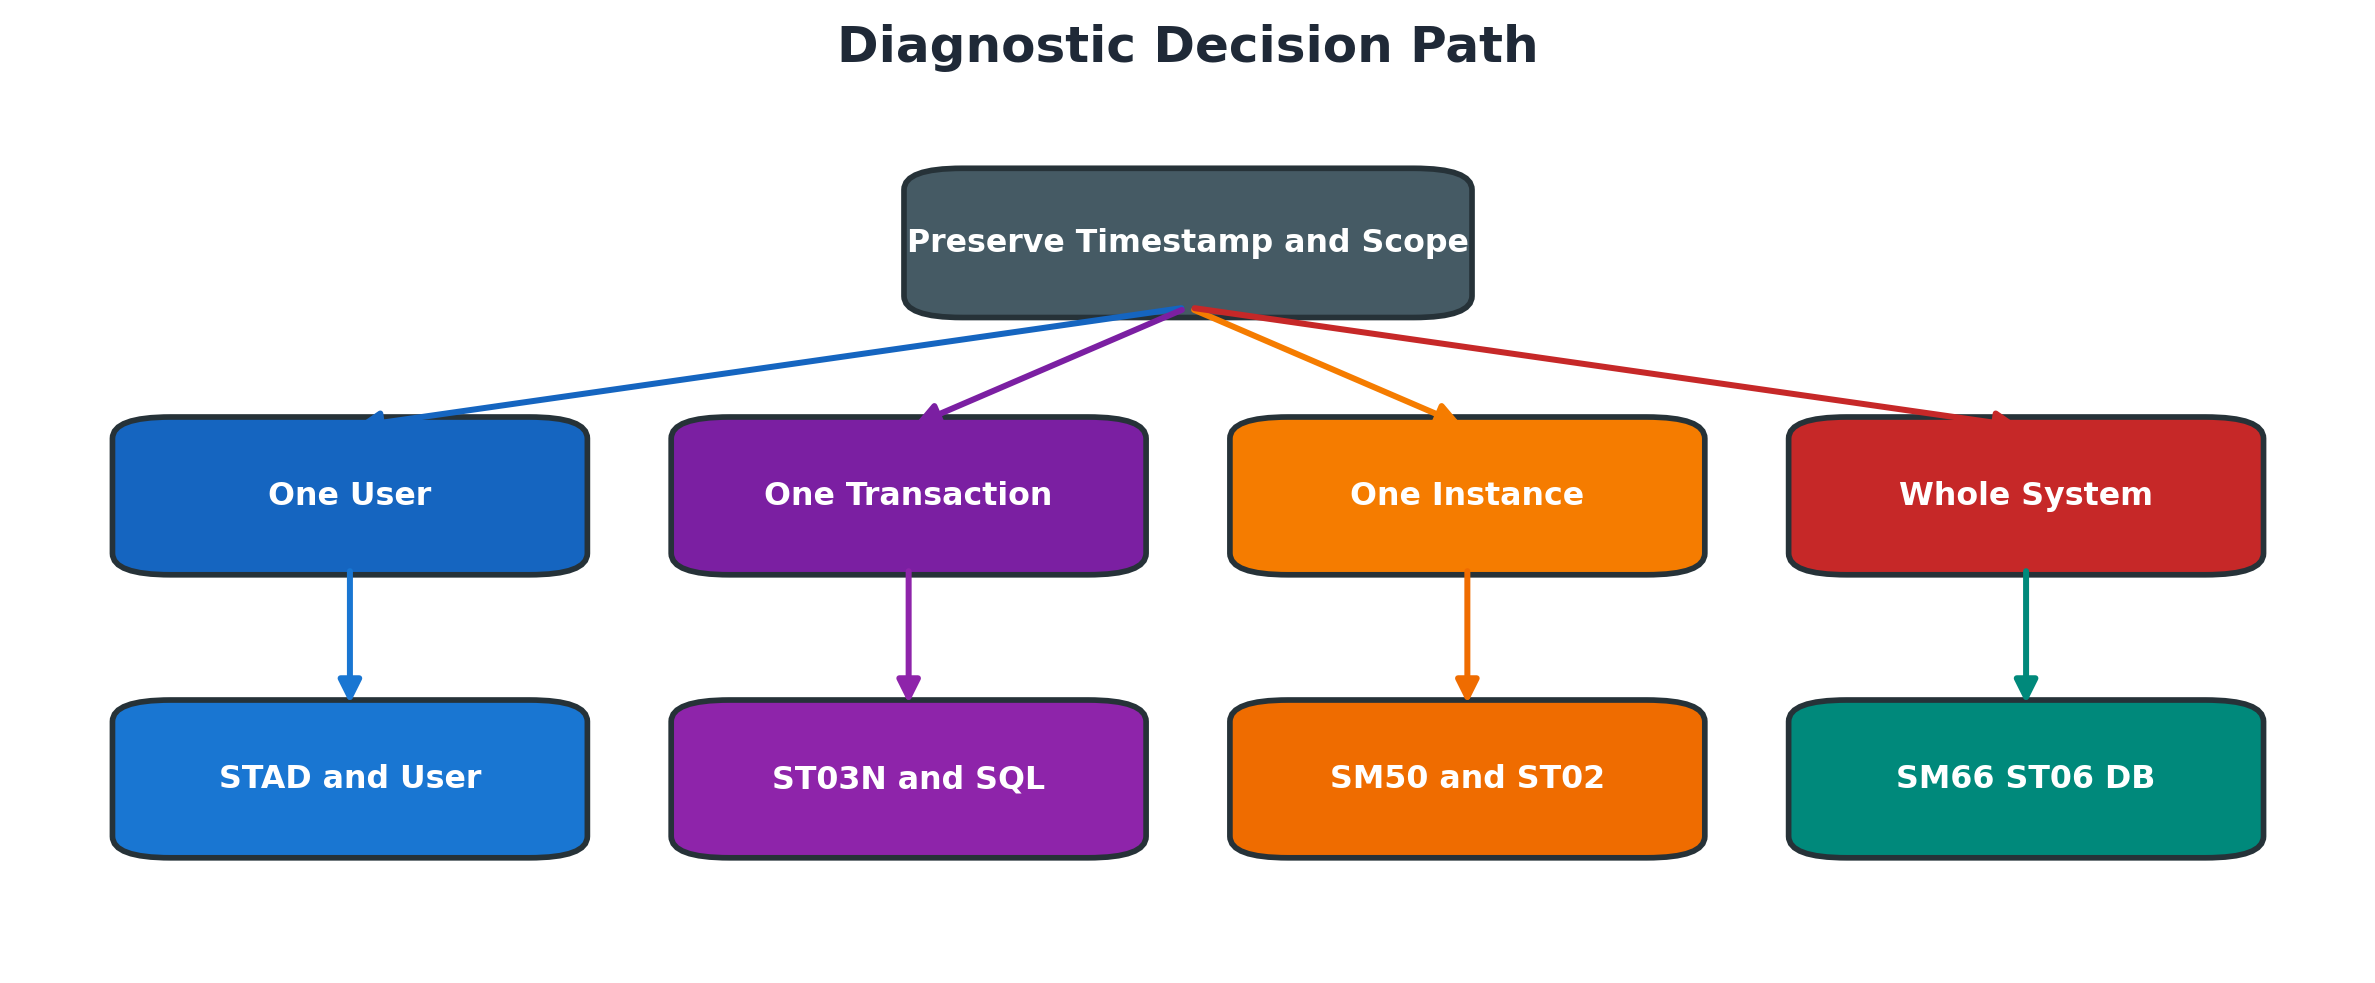
Figure 8.5 Diagnostic decision path
Use this diagnostic order:
- Capture exact timestamp, scope and business impact.
- Check availability, recent changes and time synchronization.
- Classify one user, one transaction, one instance or whole system.
- Measure workload and dominant response-time component.
- Correlate live processes with historical records.
- Follow evidence to locks, update, memory, host, database, SQL, RFC or application layer.
- Apply one controlled correction with rollback.
- Repeat the same workload and monitor for recurrence.
ST03N Average Looks Normal but Users Are Slow
Symptom: daily average is acceptable while a user group reports delays. Cause: hourly spike, one instance, one transaction or small population hidden by aggregation. Diagnosis: drill to incident hour/instance/transaction and inspect STAD distribution. Solution: correct the localized capacity, SQL or dependency issue. Validation: affected percentile/records and user action improve, not just the daily average.
Work Processes Remain in PRIV
Symptom: SM50 shows multiple long PRIV processes and dialog capacity falls. Causes: extended-memory exhaustion, large selections, program allocation or unsuitable concurrency. Diagnosis: correlate program/user with ST02, ST06 paging and dumps. Solution: restrict/package workload or correct memory sizing through controlled change; do not repeatedly kill without business checks. Validation: PRIV count and wait time remain normal during peak.
CPU Is High but SAP Response Is Normal
Symptom: ST06 reports high CPU yet users are not slow. Cause: efficient batch throughput, short peak or non-SAP process with remaining capacity. Diagnosis: check duration, run queue, per-core/top process and ST03N throughput/response. Solution: monitor or reschedule only when service risk is proven. Validation: response SLAs and queues remain stable.
Response Time Is High but CPU Is Low
Symptom: dialog response rises while CPU stays low. Likely causes: work-process wait, database I/O/locks, RFC/network, enqueue or storage latency. Diagnosis: decompose STAD and correlate the dominant component. Solution: repair that dependency instead of adding CPU. Validation: component time and total response fall together.
Buffer Swaps Increase After Transport
Symptom: ST02 swaps/load time rise after import. Cause: invalidated/cold program or nametab buffers, new footprint or undersized buffer. Diagnosis: correlate import/restart time, specific buffer and stabilization trend. Solution: allow controlled warm-up or tune only from sustained evidence. Validation: swaps stabilize without host paging or startup risk.
SM50 Cancel Does Not End the Problem
Symptom: canceled process returns or business delay continues. Cause: scheduler/interface retry, blocking DB session, lock/update dependency or multiple requests. Diagnosis: identify origin and retry owner plus database/lock evidence. Solution: stop the producer or dependency safely, then correct root cause. Validation: no recurrence and partial business work is reconciled.
RZ20 Alert Is Red but Service Is Healthy
Symptom: alert persists although current checks pass. Cause: stale alert, wrong threshold, collection failure or unacknowledged historical state. Diagnosis: inspect MTE value, timestamp, collection method and history. Solution: restore collection or tune threshold through governance; acknowledge only after evidence. Validation: fresh values and alert transitions match reality.
No STAD Record for Reported Incident
Symptom: detailed record cannot be found. Cause: retention expired, wrong server/time zone/filter, request used RFC/background identity or statistics were unavailable. Diagnosis: confirm system time, task type, execution user/server and aggregation evidence. Solution: preserve records sooner and reproduce safely with correct filters. Validation: new incident capture yields correlated record.
Trace Collection Makes Performance Worse
Symptom: slowdown or filesystem growth begins after tracing. Cause: broad userless trace, high trace level or long duration. Diagnosis: identify active traces/levels and file growth. Solution: deactivate, restore original levels and collect only a narrow controlled reproduction. Validation: overhead disappears and sufficient evidence remains.
Practical Scenario
Users Report Morning Slowness
Users report that several transactions are slow between 08:00 and 11:30, but performance improves later. The BASIS administrator records affected transactions and timestamps, compares ST03N hourly workload, checks SM66 during the peak and correlates ST06 and database metrics.
The evidence shows a large background workload overlapping the user peak, sustained work-process pressure and increased database time. The team reschedules eligible jobs, corrects the workload window and validates the next morning against the same hourly baseline. No work process is canceled and no parameter is changed without evidence.
Resolve the recurring peak issue:
- Collect reports with exact morning timestamps.
- Compare hourly ST03N profiles across several days.
- Capture SM66 during the affected window.
- Correlate ST06 and database metrics for the same period.
- Identify overlapping jobs and affected dialog capacity.
- Confirm job owners, deadlines and dependencies.
- Move eligible jobs through approved scheduling change.
- Validate several comparable mornings and record the new baseline.
Expected Results and Validation
Dialog response time and dispatcher wait return toward baseline, business steps complete within the agreed target, background jobs still meet their deadline, no new dumps or update failures appear and the improvement remains visible across several comparable mornings.
Summary
Reliable SAP performance analysis begins with a timestamped business symptom and follows evidence across workload aggregates, individual statistical records, work processes, memory, operating system, database and dependent services. A single high metric is not a root cause. The administrator must compare a valid baseline, identify the dominant response-time component, correct the confirmed layer through change control, and repeat the same business test while checking throughput and regressions.
Key Takeaways
Effective SAP monitoring starts with time, scope and baseline. ST03N shows aggregated workload, STAD explains individual steps, and SM50 or SM66 provides the live process view.
A performance correction is complete only when the same business workload is retested, the dominant time component improves and no new operational risk is introduced.
Retain these monitoring habits:
- Start with time scope and measurable impact
- Use trends and baselines before thresholds
- Break response time into components before choosing a tool
- Correlate live work processes with historical workload
- Treat traces and control actions as production changes
- Close only after comparable business validation
Content Coverage Validation
This chapter independently covers monitoring strategy, system health, response-time analysis, work processes, locks, updates, buffers, memory, operating system, database, SQL, traces, CCMS alerts, practical investigation, security and validation.
The organization, wording, procedures, tables and multi-colour diagrams are original. Classic Week 1 monitoring topics were expanded into a current operational tutorial without copying source figures or screenshots.